Gene Page: NOVA2
Summary ?
| GeneID | 4858 |
| Symbol | NOVA2 |
| Synonyms | ANOVA|NOVA3 |
| Description | neuro-oncological ventral antigen 2 |
| Reference | MIM:601991|HGNC:HGNC:7887|Ensembl:ENSG00000104967|HPRD:03588|Vega:OTTHUMG00000177499 |
| Gene type | protein-coding |
| Map location | 19q13.3 |
| Pascal p-value | 0.034 |
| Sherlock p-value | 0.002 |
| Fetal beta | 0.19 |
| DMG | 1 (# studies) |
Gene in Data Sources
| Gene set name | Method of gene set | Description | Info |
|---|---|---|---|
| CV:PGCnp | Genome-wide Association Study | GWAS | |
| DMG:Wockner_2014 | Genome-wide DNA methylation analysis | This dataset includes 4641 differentially methylated probes corresponding to 2929 unique genes between schizophrenia patients (n=24) and controls (n=24). | 1 |
Section I. Genetics and epigenetics annotation
 Differentially methylated gene
| Probe | Chromosome | Position | Nearest gene | P (dis) | Beta (dis) | FDR (dis) | Study |
|---|---|---|---|---|---|---|---|
| cg21632975 | 19 | 46456210 | NOVA2 | 6.015E-4 | 0.275 | 0.05 | DMG:Wockner_2014 |
Section II. Transcriptome annotation
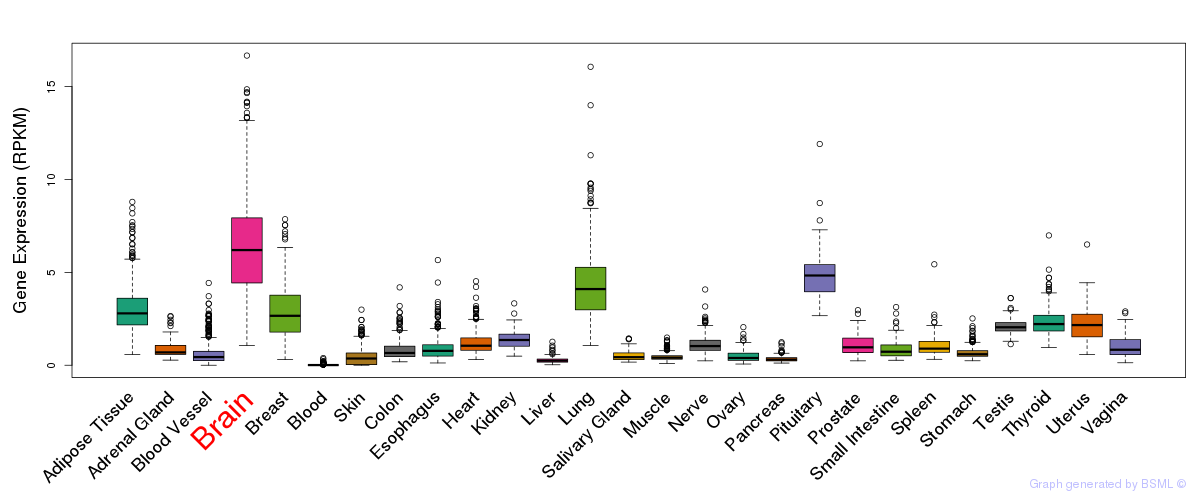
General gene expression (GTEx)
Gene expression during devlopment (BrainCloud)
Footnote:
A total of 269 time points ploted, with n=38 fetal samples (x=1:38). Each triangle represents one time point.
Gene expression of temporal and spatial changes (BrainSpan)
Footnote:
SC: sub-cortical regions; SM: sensory-motor regions; FC: frontal cortex; and TP: temporal-parietal cortex
ST1: fetal (13 - 26 postconception weeks), ST2: early infancy to late childhood (4 months to 11 years), and ST3: adolescence to adulthood (13 - 23 years)
The bar shown representes the lower 25% and upper 25% of the expression distribution.
Top co-expressed genes in brain regions
| Top 10 positively co-expressed genes | ||
| Gene | Pearson's Correlation | Spearman's Correlation |
| LMO4 | 0.77 | 0.78 |
| MIPEP | 0.77 | 0.72 |
| NPY1R | 0.76 | 0.86 |
| AADAT | 0.76 | 0.69 |
| EXOC6 | 0.74 | 0.79 |
| ANKMY2 | 0.74 | 0.76 |
| GRM7 | 0.73 | 0.73 |
| PLK2 | 0.73 | 0.77 |
| STK32B | 0.72 | 0.70 |
| RUNDC3B | 0.72 | 0.77 |
| Top 10 negatively co-expressed genes | ||
| Gene | Pearson's Correlation | Spearman's Correlation |
| MT-CO2 | -0.56 | -0.65 |
| AIFM3 | -0.56 | -0.62 |
| AF347015.33 | -0.55 | -0.63 |
| AF347015.31 | -0.54 | -0.63 |
| MT-CYB | -0.54 | -0.63 |
| HSD17B14 | -0.54 | -0.64 |
| AF347015.8 | -0.53 | -0.65 |
| AF347015.2 | -0.53 | -0.64 |
| AF347015.27 | -0.53 | -0.61 |
| AF347015.15 | -0.53 | -0.63 |
Section V. Pathway annotation
| Pathway name | Pathway size | # SZGR 2.0 genes in pathway | Info |
|---|---|---|---|
| MULLIGHAN MLL SIGNATURE 1 DN | 242 | 165 | All SZGR 2.0 genes in this pathway |
| BENPORATH ES WITH H3K27ME3 | 1118 | 744 | All SZGR 2.0 genes in this pathway |
| SHEPARD BMYB MORPHOLINO DN | 200 | 112 | All SZGR 2.0 genes in this pathway |
| SHEPARD BMYB TARGETS | 74 | 41 | All SZGR 2.0 genes in this pathway |
| SHEPARD CRUSH AND BURN MUTANT DN | 185 | 111 | All SZGR 2.0 genes in this pathway |
| KYNG WERNER SYNDROM AND NORMAL AGING UP | 93 | 62 | All SZGR 2.0 genes in this pathway |