Gene Page: CNTN3
Summary ?
| GeneID | 5067 |
| Symbol | CNTN3 |
| Synonyms | BIG-1|PANG|PCS |
| Description | contactin 3 |
| Reference | MIM:601325|HGNC:HGNC:2173|Ensembl:ENSG00000113805|Vega:OTTHUMG00000158813 |
| Gene type | protein-coding |
| Map location | 3p12.3 |
| Pascal p-value | 0.051 |
| TADA p-value | 0.002 |
| Fetal beta | 0.797 |
| eGene | Caudate basal ganglia Nucleus accumbens basal ganglia |
| Support | CELL ADHESION AND TRANSSYNAPTIC SIGNALING CompositeSet |
Gene in Data Sources
| Gene set name | Method of gene set | Description | Info |
|---|---|---|---|
| CV:PGCnp | Genome-wide Association Study | GWAS | |
| DNM:Fromer_2014 | Whole Exome Sequencing analysis | This study reported a WES study of 623 schizophrenia trios, reporting DNMs using genomic DNA. | |
| PMID:cooccur | High-throughput literature-search | Systematic search in PubMed for genes co-occurring with SCZ keywords. A total of 3027 genes were included. | |
| GSMA_IIE | Genome scan meta-analysis (European-ancestry samples) | Psr: 0.04359 | |
| GSMA_IIA | Genome scan meta-analysis (All samples) | Psr: 0.04047 | |
| Literature | High-throughput literature-search | Co-occurance with Schizophrenia keywords: schizophrenia,schizophrenias | Click to show details |
Section I. Genetics and epigenetics annotation
 DNM table
| Gene | Chromosome | Position | Ref | Alt | Transcript | AA change | Mutation type | Sift | CG46 | Trait | Study |
|---|---|---|---|---|---|---|---|---|---|---|---|
| CNTN3 | chr3 | 74334644 | T | A | NM_020872 NM_020872 | . . | intronic splice-acceptor-in2 | Schizophrenia | DNM:Fromer_2014 |
Section II. Transcriptome annotation
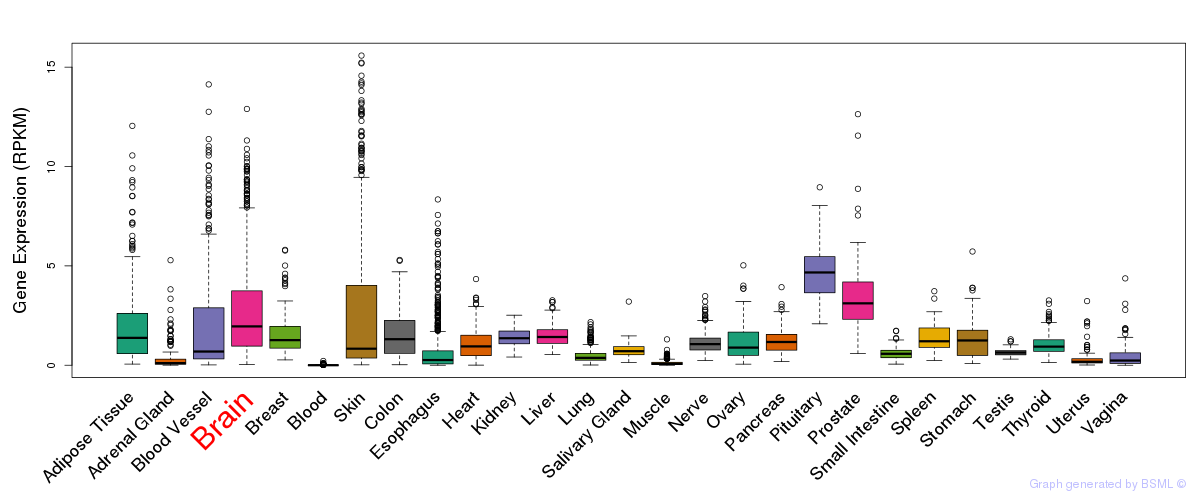
General gene expression (GTEx)
Gene expression during devlopment (BrainCloud)
Footnote:
A total of 269 time points ploted, with n=38 fetal samples (x=1:38). Each triangle represents one time point.
Gene expression of temporal and spatial changes (BrainSpan)
Footnote:
SC: sub-cortical regions; SM: sensory-motor regions; FC: frontal cortex; and TP: temporal-parietal cortex
ST1: fetal (13 - 26 postconception weeks), ST2: early infancy to late childhood (4 months to 11 years), and ST3: adolescence to adulthood (13 - 23 years)
The bar shown representes the lower 25% and upper 25% of the expression distribution.
Top co-expressed genes in brain regions
| Top 10 positively co-expressed genes | ||
| Gene | Pearson's Correlation | Spearman's Correlation |
| AP000751.3 | 0.92 | 0.91 |
| CAMTA1 | 0.90 | 0.90 |
| BSN | 0.89 | 0.87 |
| SCN8A | 0.89 | 0.87 |
| HCN1 | 0.89 | 0.88 |
| DLGAP1 | 0.89 | 0.86 |
| SORL1 | 0.88 | 0.82 |
| ADAM22 | 0.88 | 0.88 |
| ATP2B2 | 0.88 | 0.87 |
| PLCB1 | 0.88 | 0.84 |
| Top 10 negatively co-expressed genes | ||
| Gene | Pearson's Correlation | Spearman's Correlation |
| RAB34 | -0.48 | -0.56 |
| DBI | -0.45 | -0.57 |
| C1orf61 | -0.45 | -0.64 |
| EFEMP2 | -0.44 | -0.44 |
| RAB13 | -0.44 | -0.53 |
| SAT1 | -0.41 | -0.55 |
| C1orf54 | -0.41 | -0.56 |
| GNG11 | -0.40 | -0.54 |
| EIF4EBP3 | -0.40 | -0.47 |
| PECI | -0.40 | -0.44 |
Section III. Gene Ontology annotation
| Molecular function | GO term | Evidence | Neuro keywords | PubMed ID |
|---|---|---|---|---|
| GO:0005515 | protein binding | IEA | - | |
| Biological process | GO term | Evidence | Neuro keywords | PubMed ID |
| GO:0007155 | cell adhesion | IEA | - | |
| Cellular component | GO term | Evidence | Neuro keywords | PubMed ID |
| GO:0005886 | plasma membrane | IEA | - | |
| GO:0031225 | anchored to membrane | IEA | - |
Section V. Pathway annotation
| Pathway name | Pathway size | # SZGR 2.0 genes in pathway | Info |
|---|---|---|---|
| NEWMAN ERCC6 TARGETS DN | 39 | 24 | All SZGR 2.0 genes in this pathway |
| LEE CALORIE RESTRICTION NEOCORTEX DN | 88 | 58 | All SZGR 2.0 genes in this pathway |
| CHANDRAN METASTASIS DN | 306 | 191 | All SZGR 2.0 genes in this pathway |
| CHICAS RB1 TARGETS GROWING | 243 | 155 | All SZGR 2.0 genes in this pathway |
| CHICAS RB1 TARGETS CONFLUENT | 567 | 365 | All SZGR 2.0 genes in this pathway |
| PURBEY TARGETS OF CTBP1 NOT SATB1 DN | 448 | 282 | All SZGR 2.0 genes in this pathway |
| BRIDEAU IMPRINTED GENES | 63 | 47 | All SZGR 2.0 genes in this pathway |
Section VI. microRNA annotation
| miRNA family | Target position | miRNA ID | miRNA seq | ||
|---|---|---|---|---|---|
| UTR start | UTR end | Match method | |||
| miR-124.1 | 177 | 184 | 1A,m8 | hsa-miR-124a | UUAAGGCACGCGGUGAAUGCCA |
| miR-124/506 | 177 | 183 | 1A | hsa-miR-506 | UAAGGCACCCUUCUGAGUAGA |
| hsa-miR-124brain | UAAGGCACGCGGUGAAUGCC | ||||
| miR-299-5p | 196 | 202 | 1A | hsa-miR-299-5p | UGGUUUACCGUCCCACAUACAU |
| miR-329 | 1770 | 1776 | 1A | hsa-miR-329brain | AACACACCUGGUUAACCUCUUU |
| miR-9 | 199 | 205 | m8 | hsa-miR-9SZ | UCUUUGGUUAUCUAGCUGUAUGA |
- SZ: miRNAs which differentially expressed in brain cortex of schizophrenia patients comparing with control samples using microarray. Click here to see the list of SZ related miRNAs.
- Brain: miRNAs which are expressed in brain based on miRNA microarray expression studies. Click here to see the list of brain related miRNAs.