Gene Page: SPTBN5
Summary ?
| GeneID | 51332 |
| Symbol | SPTBN5 |
| Synonyms | BSPECV|HUBSPECV|HUSPECV |
| Description | spectrin beta, non-erythrocytic 5 |
| Reference | MIM:605916|HGNC:HGNC:15680|Ensembl:ENSG00000137877|HPRD:10438|Vega:OTTHUMG00000172720 |
| Gene type | protein-coding |
| Map location | 15q21 |
| Pascal p-value | 0.474 |
| Fetal beta | -0.573 |
| DMG | 1 (# studies) |
| eGene | Caudate basal ganglia Cerebellar Hemisphere Cerebellum Cortex Frontal Cortex BA9 Hippocampus Nucleus accumbens basal ganglia Myers' cis & trans |
| Support | CompositeSet |
Gene in Data Sources
| Gene set name | Method of gene set | Description | Info |
|---|---|---|---|
| CV:PGCnp | Genome-wide Association Study | GWAS | |
| DMG:Wockner_2014 | Genome-wide DNA methylation analysis | This dataset includes 4641 differentially methylated probes corresponding to 2929 unique genes between schizophrenia patients (n=24) and controls (n=24). | 2 |
| DNM:Fromer_2014 | Whole Exome Sequencing analysis | This study reported a WES study of 623 schizophrenia trios, reporting DNMs using genomic DNA. |
Section I. Genetics and epigenetics annotation
 DNM table
| Gene | Chromosome | Position | Ref | Alt | Transcript | AA change | Mutation type | Sift | CG46 | Trait | Study |
|---|---|---|---|---|---|---|---|---|---|---|---|
| SPTBN5 | chr15 | 42148742 | T | C | NM_016642 | p.2920T>A | missense | Schizophrenia | DNM:Fromer_2014 |
Differentially methylated gene
| Probe | Chromosome | Position | Nearest gene | P (dis) | Beta (dis) | FDR (dis) | Study |
|---|---|---|---|---|---|---|---|
| cg24203709 | 15 | 42187179 | SPTBN5 | 2.984E-4 | 0.277 | 0.039 | DMG:Wockner_2014 |
| cg18188010 | 15 | 42187036 | SPTBN5 | 4.413E-4 | 0.414 | 0.045 | DMG:Wockner_2014 |
eQTL annotation
| SNP ID | Chromosome | Position | eGene | Gene Entrez ID | pvalue | qvalue | TSS distance | eQTL type |
|---|---|---|---|---|---|---|---|---|
| rs17572651 | chr1 | 218943612 | SPTBN5 | 51332 | 0.05 | trans | ||
| rs16829545 | chr2 | 151977407 | SPTBN5 | 51332 | 0.02 | trans | ||
| rs7584986 | chr2 | 184111432 | SPTBN5 | 51332 | 0.18 | trans | ||
| rs6864793 | chr5 | 61050836 | SPTBN5 | 51332 | 0.09 | trans | ||
| rs17762315 | chr5 | 76807576 | SPTBN5 | 51332 | 0.07 | trans | ||
| rs12098525 | chr10 | 87501764 | SPTBN5 | 51332 | 0.04 | trans | ||
| rs12359579 | chr10 | 87511020 | SPTBN5 | 51332 | 0.09 | trans | ||
| rs16955618 | chr15 | 29937543 | SPTBN5 | 51332 | 2.561E-4 | trans | ||
| rs17085767 | chr18 | 69839397 | SPTBN5 | 51332 | 0.12 | trans |
Section II. Transcriptome annotation
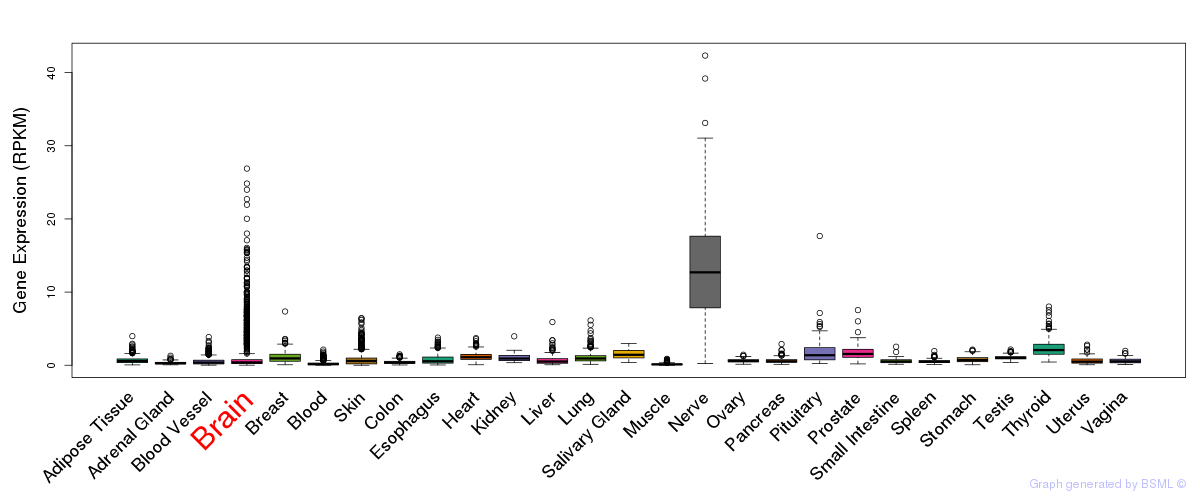
General gene expression (GTEx)
Gene expression during devlopment (BrainCloud)
Footnote:
A total of 269 time points ploted, with n=38 fetal samples (x=1:38). Each triangle represents one time point.
Gene expression of temporal and spatial changes (BrainSpan)
Footnote:
SC: sub-cortical regions; SM: sensory-motor regions; FC: frontal cortex; and TP: temporal-parietal cortex
ST1: fetal (13 - 26 postconception weeks), ST2: early infancy to late childhood (4 months to 11 years), and ST3: adolescence to adulthood (13 - 23 years)
The bar shown representes the lower 25% and upper 25% of the expression distribution.
No co-expressed genes in brain regions
Section V. Pathway annotation
| Pathway name | Pathway size | # SZGR 2.0 genes in pathway | Info |
|---|---|---|---|
| REACTOME DEVELOPMENTAL BIOLOGY | 396 | 292 | All SZGR 2.0 genes in this pathway |
| REACTOME AXON GUIDANCE | 251 | 188 | All SZGR 2.0 genes in this pathway |
| REACTOME NCAM SIGNALING FOR NEURITE OUT GROWTH | 64 | 49 | All SZGR 2.0 genes in this pathway |
| REACTOME L1CAM INTERACTIONS | 86 | 62 | All SZGR 2.0 genes in this pathway |
| REACTOME INTERACTION BETWEEN L1 AND ANKYRINS | 23 | 19 | All SZGR 2.0 genes in this pathway |
| SHEN SMARCA2 TARGETS DN | 357 | 212 | All SZGR 2.0 genes in this pathway |
| ACEVEDO LIVER TUMOR VS NORMAL ADJACENT TISSUE DN | 274 | 165 | All SZGR 2.0 genes in this pathway |