Gene Page: PDGFRL
Summary ?
| GeneID | 5157 |
| Symbol | PDGFRL |
| Synonyms | PDGRL|PRLTS |
| Description | platelet derived growth factor receptor like |
| Reference | MIM:604584|HGNC:HGNC:8805|Ensembl:ENSG00000104213|HPRD:05206|Vega:OTTHUMG00000130818 |
| Gene type | protein-coding |
| Map location | 8p22-p21.3 |
| Pascal p-value | 0.071 |
| Fetal beta | -0.349 |
| DMG | 1 (# studies) |
| eGene | Cerebellum Myers' cis & trans Meta |
Gene in Data Sources
| Gene set name | Method of gene set | Description | Info |
|---|---|---|---|
| CV:PGCnp | Genome-wide Association Study | GWAS | |
| DMG:Jaffe_2016 | Genome-wide DNA methylation analysis | This dataset includes 2,104 probes/CpGs associated with SZ patients (n=108) compared to 136 controls at Bonferroni-adjusted P < 0.05. | 1 |
| GSMA_I | Genome scan meta-analysis | Psr: 0.031 | |
| GSMA_IIE | Genome scan meta-analysis (European-ancestry samples) | Psr: 0.00057 | |
| GSMA_IIA | Genome scan meta-analysis (All samples) | Psr: 0.03086 |
Section I. Genetics and epigenetics annotation
 Differentially methylated gene
| Probe | Chromosome | Position | Nearest gene | P (dis) | Beta (dis) | FDR (dis) | Study |
|---|---|---|---|---|---|---|---|
| cg10501177 | 8 | 17435088 | PDGFRL | 2.3E-8 | -0.014 | 7.61E-6 | DMG:Jaffe_2016 |
eQTL annotation
| SNP ID | Chromosome | Position | eGene | Gene Entrez ID | pvalue | qvalue | TSS distance | eQTL type |
|---|---|---|---|---|---|---|---|---|
| rs17131472 | chr1 | 91962966 | PDGFRL | 5157 | 0.07 | trans | ||
| rs2976809 | chr3 | 125451738 | PDGFRL | 5157 | 0.01 | trans | ||
| rs16889842 | chr4 | 9872012 | PDGFRL | 5157 | 0.01 | trans | ||
| rs12647883 | chr4 | 9878463 | PDGFRL | 5157 | 0.14 | trans | ||
| rs4033102 | chr4 | 111784204 | PDGFRL | 5157 | 0.16 | trans | ||
| rs509952 | chr4 | 111788169 | PDGFRL | 5157 | 0.16 | trans | ||
| rs313946 | chr4 | 113975904 | PDGFRL | 5157 | 0 | trans | ||
| rs657141 | chr4 | 113981041 | PDGFRL | 5157 | 0.12 | trans | ||
| rs778995 | 0 | PDGFRL | 5157 | 0.2 | trans | |||
| rs17056435 | chr5 | 158453782 | PDGFRL | 5157 | 0.04 | trans | ||
| rs6920042 | chr6 | 67907570 | PDGFRL | 5157 | 0.02 | trans | ||
| rs6455226 | chr6 | 67930295 | PDGFRL | 5157 | 0.17 | trans | ||
| rs9451867 | chr6 | 92659609 | PDGFRL | 5157 | 8.474E-4 | trans | ||
| rs10958892 | chr9 | 10125117 | PDGFRL | 5157 | 0.07 | trans | ||
| rs10958896 | chr9 | 10126894 | PDGFRL | 5157 | 0.08 | trans | ||
| rs10958899 | chr9 | 10128700 | PDGFRL | 5157 | 0.09 | trans | ||
| rs10958907 | chr9 | 10131580 | PDGFRL | 5157 | 0.08 | trans | ||
| rs10958910 | chr9 | 10134759 | PDGFRL | 5157 | 0.17 | trans | ||
| rs998410 | chr9 | 117622673 | PDGFRL | 5157 | 0.05 | trans | ||
| rs9423711 | chr10 | 2574802 | PDGFRL | 5157 | 0.07 | trans | ||
| rs10747972 | 0 | PDGFRL | 5157 | 0.04 | trans | |||
| rs11112163 | chr12 | 105072508 | PDGFRL | 5157 | 0.07 | trans | ||
| rs9551590 | chr13 | 29589464 | PDGFRL | 5157 | 0 | trans | ||
| rs10142086 | chr14 | 35135892 | PDGFRL | 5157 | 0.18 | trans | ||
| rs2093759 | chr14 | 97171024 | PDGFRL | 5157 | 0.03 | trans | ||
| rs17244419 | chr14 | 97171074 | PDGFRL | 5157 | 4.64E-4 | trans | ||
| rs7177212 | chr15 | 34425413 | PDGFRL | 5157 | 0.03 | trans | ||
| rs13380712 | chr16 | 25601181 | PDGFRL | 5157 | 0.2 | trans | ||
| rs16961159 | chr16 | 59561686 | PDGFRL | 5157 | 0.19 | trans | ||
| rs17841422 | chr17 | 20969134 | PDGFRL | 5157 | 0.05 | trans | ||
| rs16977927 | chr17 | 72154232 | PDGFRL | 5157 | 0.02 | trans | ||
| rs7236104 | chr18 | 14032818 | PDGFRL | 5157 | 0.03 | trans | ||
| rs11873703 | chr18 | 61448702 | PDGFRL | 5157 | 0.1 | trans | ||
| rs6095741 | chr20 | 48666589 | PDGFRL | 5157 | 1.51E-4 | trans |
Section II. Transcriptome annotation
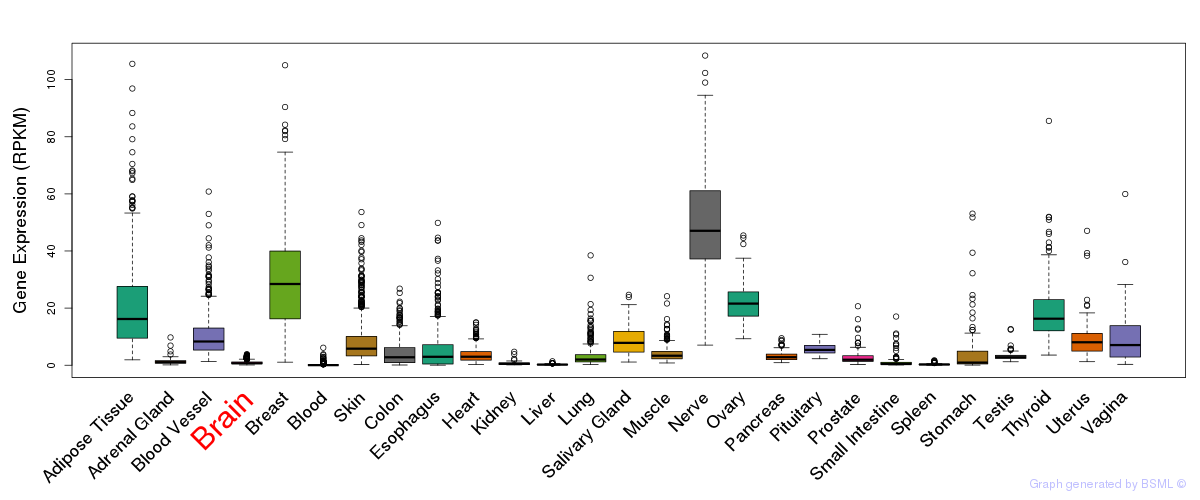
General gene expression (GTEx)
Gene expression during devlopment (BrainCloud)
Footnote:
A total of 269 time points ploted, with n=38 fetal samples (x=1:38). Each triangle represents one time point.
Gene expression of temporal and spatial changes (BrainSpan)
Footnote:
SC: sub-cortical regions; SM: sensory-motor regions; FC: frontal cortex; and TP: temporal-parietal cortex
ST1: fetal (13 - 26 postconception weeks), ST2: early infancy to late childhood (4 months to 11 years), and ST3: adolescence to adulthood (13 - 23 years)
The bar shown representes the lower 25% and upper 25% of the expression distribution.
Top co-expressed genes in brain regions
| Top 10 positively co-expressed genes | ||
| Gene | Pearson's Correlation | Spearman's Correlation |
| MED23 | 0.92 | 0.94 |
| TTC17 | 0.92 | 0.93 |
| C21orf66 | 0.92 | 0.93 |
| FIGNL1 | 0.92 | 0.93 |
| ZC3H7A | 0.92 | 0.94 |
| HARS2 | 0.91 | 0.91 |
| ZNF211 | 0.91 | 0.91 |
| PALB2 | 0.91 | 0.94 |
| CCDC82 | 0.90 | 0.92 |
| ZNF23 | 0.90 | 0.91 |
| Top 10 negatively co-expressed genes | ||
| Gene | Pearson's Correlation | Spearman's Correlation |
| AF347015.31 | -0.77 | -0.86 |
| MT-CO2 | -0.77 | -0.86 |
| IFI27 | -0.75 | -0.85 |
| AF347015.27 | -0.74 | -0.82 |
| MT-CYB | -0.74 | -0.83 |
| AF347015.8 | -0.73 | -0.85 |
| AF347015.33 | -0.73 | -0.81 |
| HIGD1B | -0.72 | -0.85 |
| AIFM3 | -0.72 | -0.76 |
| FXYD1 | -0.71 | -0.82 |
Section III. Gene Ontology annotation
| Molecular function | GO term | Evidence | Neuro keywords | PubMed ID |
|---|---|---|---|---|
| GO:0005019 | platelet-derived growth factor beta-receptor activity | TAS | 7898930 | |
| GO:0004992 | platelet activating factor receptor activity | TAS | 7898930 | |
| Biological process | GO term | Evidence | Neuro keywords | PubMed ID |
| GO:0008150 | biological_process | ND | - | |
| Cellular component | GO term | Evidence | Neuro keywords | PubMed ID |
| GO:0005576 | extracellular region | IEA | - |
Section V. Pathway annotation
| Pathway name | Pathway size | # SZGR 2.0 genes in pathway | Info |
|---|---|---|---|
| DAVICIONI MOLECULAR ARMS VS ERMS DN | 182 | 111 | All SZGR 2.0 genes in this pathway |
| FULCHER INFLAMMATORY RESPONSE LECTIN VS LPS DN | 463 | 290 | All SZGR 2.0 genes in this pathway |
| CORRE MULTIPLE MYELOMA UP | 74 | 45 | All SZGR 2.0 genes in this pathway |
| SENESE HDAC1 AND HDAC2 TARGETS DN | 232 | 139 | All SZGR 2.0 genes in this pathway |
| ELVIDGE HYPOXIA UP | 171 | 112 | All SZGR 2.0 genes in this pathway |
| DODD NASOPHARYNGEAL CARCINOMA DN | 1375 | 806 | All SZGR 2.0 genes in this pathway |
| GOZGIT ESR1 TARGETS DN | 781 | 465 | All SZGR 2.0 genes in this pathway |
| LINDGREN BLADDER CANCER CLUSTER 1 DN | 378 | 231 | All SZGR 2.0 genes in this pathway |
| CHIN BREAST CANCER COPY NUMBER DN | 16 | 10 | All SZGR 2.0 genes in this pathway |
| CONCANNON APOPTOSIS BY EPOXOMICIN DN | 172 | 112 | All SZGR 2.0 genes in this pathway |
| GAUSSMANN MLL AF4 FUSION TARGETS E UP | 97 | 60 | All SZGR 2.0 genes in this pathway |
| HAMAI APOPTOSIS VIA TRAIL UP | 584 | 356 | All SZGR 2.0 genes in this pathway |
| LINDGREN BLADDER CANCER CLUSTER 2B | 392 | 251 | All SZGR 2.0 genes in this pathway |
| DACOSTA ERCC3 ALLELE XPCS VS TTD DN | 36 | 27 | All SZGR 2.0 genes in this pathway |
| ONDER CDH1 TARGETS 2 UP | 256 | 159 | All SZGR 2.0 genes in this pathway |
| ROZANOV MMP14 TARGETS UP | 266 | 171 | All SZGR 2.0 genes in this pathway |
| BROWNE HCMV INFECTION 48HR DN | 504 | 323 | All SZGR 2.0 genes in this pathway |
| KYNG DNA DAMAGE BY 4NQO | 38 | 24 | All SZGR 2.0 genes in this pathway |
| KYNG DNA DAMAGE DN | 195 | 135 | All SZGR 2.0 genes in this pathway |
| HELLER HDAC TARGETS UP | 317 | 208 | All SZGR 2.0 genes in this pathway |
| HELLER HDAC TARGETS SILENCED BY METHYLATION UP | 461 | 298 | All SZGR 2.0 genes in this pathway |
| AMBROSINI FLAVOPIRIDOL TREATMENT TP53 | 109 | 63 | All SZGR 2.0 genes in this pathway |
| BOQUEST STEM CELL UP | 260 | 174 | All SZGR 2.0 genes in this pathway |
| BOQUEST STEM CELL CULTURED VS FRESH DN | 31 | 25 | All SZGR 2.0 genes in this pathway |
| CLIMENT BREAST CANCER COPY NUMBER DN | 8 | 7 | All SZGR 2.0 genes in this pathway |
| HAN SATB1 TARGETS DN | 442 | 275 | All SZGR 2.0 genes in this pathway |
| CHEN METABOLIC SYNDROM NETWORK | 1210 | 725 | All SZGR 2.0 genes in this pathway |
| CAIRO HEPATOBLASTOMA CLASSES UP | 605 | 377 | All SZGR 2.0 genes in this pathway |
| CHICAS RB1 TARGETS CONFLUENT | 567 | 365 | All SZGR 2.0 genes in this pathway |
| KIM GLIS2 TARGETS UP | 84 | 61 | All SZGR 2.0 genes in this pathway |
| WAKABAYASHI ADIPOGENESIS PPARG RXRA BOUND 8D | 882 | 506 | All SZGR 2.0 genes in this pathway |