Gene Page: PEX10
Summary ?
| GeneID | 5192 |
| Symbol | PEX10 |
| Synonyms | NALD|PBD6A|PBD6B|RNF69 |
| Description | peroxisomal biogenesis factor 10 |
| Reference | MIM:602859|HGNC:HGNC:8851|Ensembl:ENSG00000157911|HPRD:04175|Vega:OTTHUMG00000001637 |
| Gene type | protein-coding |
| Map location | 1p36.32 |
| Pascal p-value | 3.436E-6 |
| Sherlock p-value | 0.933 |
| Fetal beta | -0.634 |
| DMG | 1 (# studies) |
| eGene | Meta |
Gene in Data Sources
| Gene set name | Method of gene set | Description | Info |
|---|---|---|---|
| CV:GWAScat | Genome-wide Association Studies | This data set includes 560 SNPs associated with schizophrenia. A total of 486 genes were mapped to these SNPs within 50kb. | |
| CV:PGC128 | Genome-wide Association Study | A multi-stage schizophrenia GWAS of up to 36,989 cases and 113,075 controls. Reported by the Schizophrenia Working Group of PGC. 128 independent associations spanning 108 loci | |
| CV:PGCnp | Genome-wide Association Study | GWAS | |
| DMG:Wockner_2014 | Genome-wide DNA methylation analysis | This dataset includes 4641 differentially methylated probes corresponding to 2929 unique genes between schizophrenia patients (n=24) and controls (n=24). | 1 |
Section I. Genetics and epigenetics annotation
 CV:PGC128
| SNP ID | Chromosome | Position | Allele | P | Function | Gene | Up/Down Distance |
|---|---|---|---|---|---|---|---|
| rs4648845 | chr1 | 2387101 | TC | 4.033E-9 | intergenic | PEX10,PLCH2 | dist=43091;dist=11797 |
Differentially methylated gene
| Probe | Chromosome | Position | Nearest gene | P (dis) | Beta (dis) | FDR (dis) | Study |
|---|---|---|---|---|---|---|---|
| cg23928726 | 1 | 2344998 | PEX10 | 4.106E-4 | 0.279 | 0.044 | DMG:Wockner_2014 |
Section II. Transcriptome annotation
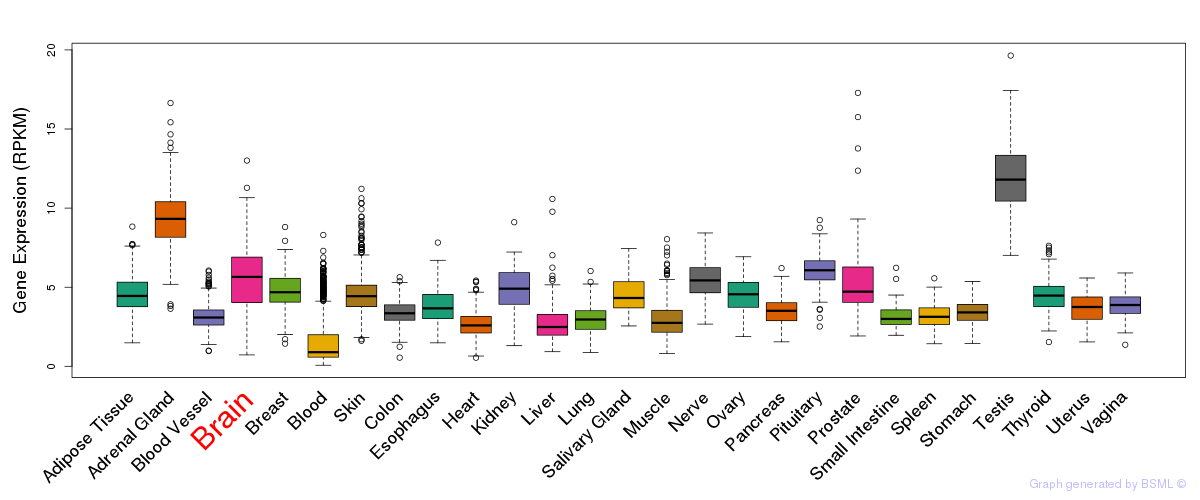
General gene expression (GTEx)
Gene expression during devlopment (BrainCloud)
Footnote:
A total of 269 time points ploted, with n=38 fetal samples (x=1:38). Each triangle represents one time point.
Gene expression of temporal and spatial changes (BrainSpan)
Footnote:
SC: sub-cortical regions; SM: sensory-motor regions; FC: frontal cortex; and TP: temporal-parietal cortex
ST1: fetal (13 - 26 postconception weeks), ST2: early infancy to late childhood (4 months to 11 years), and ST3: adolescence to adulthood (13 - 23 years)
The bar shown representes the lower 25% and upper 25% of the expression distribution.
Top co-expressed genes in brain regions
| Top 10 positively co-expressed genes | ||
| Gene | Pearson's Correlation | Spearman's Correlation |
| NAGS | 0.87 | 0.46 |
| ZIC4 | 0.85 | 0.31 |
| FZD10 | 0.85 | 0.29 |
| ZIC2 | 0.84 | 0.33 |
| ZIC1 | 0.84 | 0.35 |
| ID4 | 0.81 | 0.38 |
| KRT18P19 | 0.80 | 0.28 |
| PROX1 | 0.80 | 0.35 |
| CD247 | 0.78 | 0.35 |
| GBX2 | 0.77 | 0.37 |
| Top 10 negatively co-expressed genes | ||
| Gene | Pearson's Correlation | Spearman's Correlation |
| GTDC1 | -0.20 | -0.19 |
| AF347015.2 | -0.18 | -0.20 |
| AF347015.15 | -0.18 | -0.19 |
| MT-CYB | -0.17 | -0.19 |
| AF347015.8 | -0.17 | -0.20 |
| AF347015.27 | -0.17 | -0.20 |
| MT-ATP8 | -0.17 | -0.24 |
| AF347015.31 | -0.17 | -0.19 |
| BCAP29 | -0.17 | -0.13 |
| SSX2IP | -0.17 | -0.11 |
Section V. Pathway annotation
| Pathway name | Pathway size | # SZGR 2.0 genes in pathway | Info |
|---|---|---|---|
| KEGG PEROXISOME | 78 | 47 | All SZGR 2.0 genes in this pathway |
| KIM WT1 TARGETS DN | 459 | 276 | All SZGR 2.0 genes in this pathway |
| SETLUR PROSTATE CANCER TMPRSS2 ERG FUSION UP | 67 | 48 | All SZGR 2.0 genes in this pathway |
| KESHELAVA MULTIPLE DRUG RESISTANCE | 88 | 56 | All SZGR 2.0 genes in this pathway |
| WAKABAYASHI ADIPOGENESIS PPARG RXRA BOUND 8D | 882 | 506 | All SZGR 2.0 genes in this pathway |