Gene Page: PIGH
Summary ?
| GeneID | 5283 |
| Symbol | PIGH |
| Synonyms | GPI-H |
| Description | phosphatidylinositol glycan anchor biosynthesis class H |
| Reference | MIM:600154|HGNC:HGNC:8964|Ensembl:ENSG00000100564|HPRD:02540|Vega:OTTHUMG00000171806 |
| Gene type | protein-coding |
| Map location | 14q24.1 |
| Pascal p-value | 0.972 |
| Sherlock p-value | 0.847 |
| Fetal beta | -0.037 |
| DMG | 1 (# studies) |
| eGene | Cortex Meta |
Gene in Data Sources
| Gene set name | Method of gene set | Description | Info |
|---|---|---|---|
| DMG:Nishioka_2013 | Genome-wide DNA methylation analysis | The authors investigated the methylation profiles of DNA in peripheral blood cells from 18 patients with first-episode schizophrenia (FESZ) and from 15 normal controls. | 1 |
Section I. Genetics and epigenetics annotation
 Differentially methylated gene
| Probe | Chromosome | Position | Nearest gene | P (dis) | Beta (dis) | FDR (dis) | Study |
|---|---|---|---|---|---|---|---|
| cg12648263 | 14 | 68067090 | PIGH | -0.028 | 0.27 | DMG:Nishioka_2013 |
Section II. Transcriptome annotation
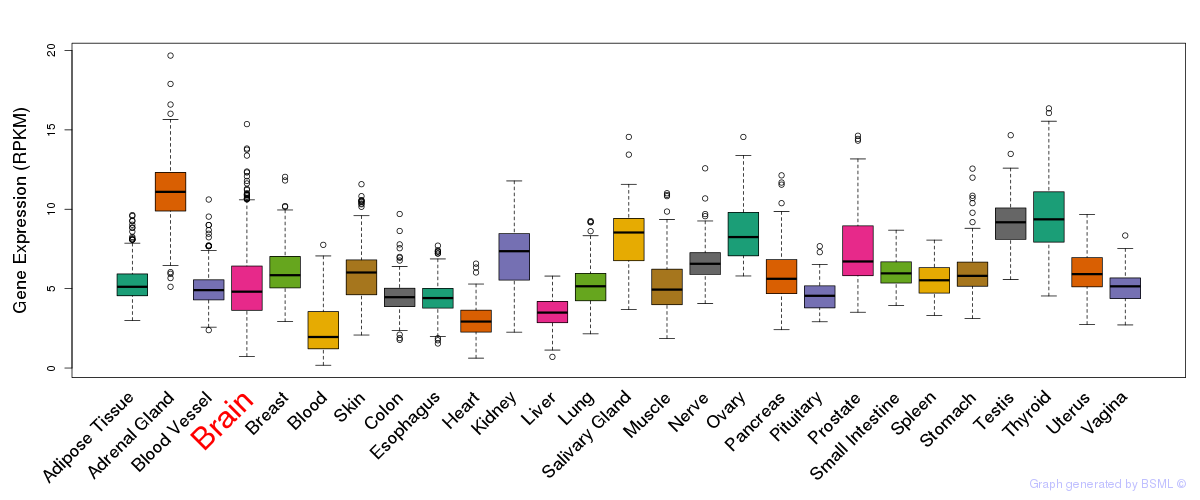
General gene expression (GTEx)

Gene expression during devlopment (BrainCloud)
Footnote:
A total of 269 time points ploted, with n=38 fetal samples (x=1:38). Each triangle represents one time point.
Gene expression of temporal and spatial changes (BrainSpan)
Footnote:
SC: sub-cortical regions; SM: sensory-motor regions; FC: frontal cortex; and TP: temporal-parietal cortex
ST1: fetal (13 - 26 postconception weeks), ST2: early infancy to late childhood (4 months to 11 years), and ST3: adolescence to adulthood (13 - 23 years)
The bar shown representes the lower 25% and upper 25% of the expression distribution.
Top co-expressed genes in brain regions
| Top 10 positively co-expressed genes | ||
| Gene | Pearson's Correlation | Spearman's Correlation |
| PSAP | 0.89 | 0.89 |
| ABHD12 | 0.87 | 0.89 |
| SNURF | 0.87 | 0.89 |
| GHITM | 0.87 | 0.90 |
| COPS7A | 0.87 | 0.88 |
| TOM1 | 0.87 | 0.88 |
| PGK1 | 0.86 | 0.87 |
| CTSD | 0.86 | 0.87 |
| SLC25A4 | 0.86 | 0.87 |
| TMX2 | 0.86 | 0.86 |
| Top 10 negatively co-expressed genes | ||
| Gene | Pearson's Correlation | Spearman's Correlation |
| AC005921.3 | -0.47 | -0.58 |
| AC010300.1 | -0.45 | -0.49 |
| ZNF814 | -0.43 | -0.48 |
| AC135724.1 | -0.42 | -0.46 |
| FAM159B | -0.42 | -0.54 |
| IL3RA | -0.41 | -0.56 |
| EIF5B | -0.41 | -0.45 |
| ANKRD36 | -0.40 | -0.49 |
| KCNMB3 | -0.40 | -0.38 |
| ANKRD36B | -0.39 | -0.48 |
Section V. Pathway annotation
| Pathway name | Pathway size | # SZGR 2.0 genes in pathway | Info |
|---|---|---|---|
| KEGG GLYCOSYLPHOSPHATIDYLINOSITOL GPI ANCHOR BIOSYNTHESIS | 25 | 17 | All SZGR 2.0 genes in this pathway |
| REACTOME METABOLISM OF PROTEINS | 518 | 242 | All SZGR 2.0 genes in this pathway |
| REACTOME POST TRANSLATIONAL MODIFICATION SYNTHESIS OF GPI ANCHORED PROTEINS | 26 | 19 | All SZGR 2.0 genes in this pathway |
| REACTOME POST TRANSLATIONAL PROTEIN MODIFICATION | 188 | 116 | All SZGR 2.0 genes in this pathway |
| REACTOME SYNTHESIS OF GLYCOSYLPHOSPHATIDYLINOSITOL GPI | 17 | 12 | All SZGR 2.0 genes in this pathway |
| SMITH TERT TARGETS UP | 145 | 91 | All SZGR 2.0 genes in this pathway |
| TAKAO RESPONSE TO UVB RADIATION UP | 86 | 55 | All SZGR 2.0 genes in this pathway |
| KAAB FAILED HEART ATRIUM DN | 141 | 99 | All SZGR 2.0 genes in this pathway |
| BROWNE HCMV INFECTION 10HR UP | 101 | 69 | All SZGR 2.0 genes in this pathway |
| COULOUARN TEMPORAL TGFB1 SIGNATURE UP | 109 | 68 | All SZGR 2.0 genes in this pathway |
| YAGI AML WITH T 9 11 TRANSLOCATION | 130 | 87 | All SZGR 2.0 genes in this pathway |
| KRIEG HYPOXIA NOT VIA KDM3A | 770 | 480 | All SZGR 2.0 genes in this pathway |