Gene Page: PLCL1
Summary ?
| GeneID | 5334 |
| Symbol | PLCL1 |
| Synonyms | PLCE|PLCL|PLDL1|PPP1R127|PRIP |
| Description | phospholipase C like 1 |
| Reference | MIM:600597|HGNC:HGNC:9063|Ensembl:ENSG00000115896|HPRD:07041| |
| Gene type | protein-coding |
| Map location | 2q33 |
| Pascal p-value | 1.12E-7 |
| Sherlock p-value | 0.916 |
| Fetal beta | -0.5 |
| DMG | 1 (# studies) |
| eGene | Myers' cis & trans |
Gene in Data Sources
| Gene set name | Method of gene set | Description | Info |
|---|---|---|---|
| CV:PGCnp | Genome-wide Association Study | GWAS | |
| DMG:Jaffe_2016 | Genome-wide DNA methylation analysis | This dataset includes 2,104 probes/CpGs associated with SZ patients (n=108) compared to 136 controls at Bonferroni-adjusted P < 0.05. | 2 |
Section I. Genetics and epigenetics annotation
 Differentially methylated gene
| Probe | Chromosome | Position | Nearest gene | P (dis) | Beta (dis) | FDR (dis) | Study |
|---|---|---|---|---|---|---|---|
| cg06098283 | 2 | 198669129 | PLCL1 | 4.23E-9 | -0.016 | 2.54E-6 | DMG:Jaffe_2016 |
| cg12148775 | 2 | 198669238 | PLCL1 | 3.81E-8 | -0.027 | 1.09E-5 | DMG:Jaffe_2016 |
eQTL annotation
| SNP ID | Chromosome | Position | eGene | Gene Entrez ID | pvalue | qvalue | TSS distance | eQTL type |
|---|---|---|---|---|---|---|---|---|
| rs11138141 | chr9 | 81916078 | PLCL1 | 5334 | 0.07 | trans | ||
| rs7907658 | chr10 | 92792387 | PLCL1 | 5334 | 0.17 | trans | ||
| rs7879848 | chrX | 68139042 | PLCL1 | 5334 | 0.04 | trans |
Section II. Transcriptome annotation
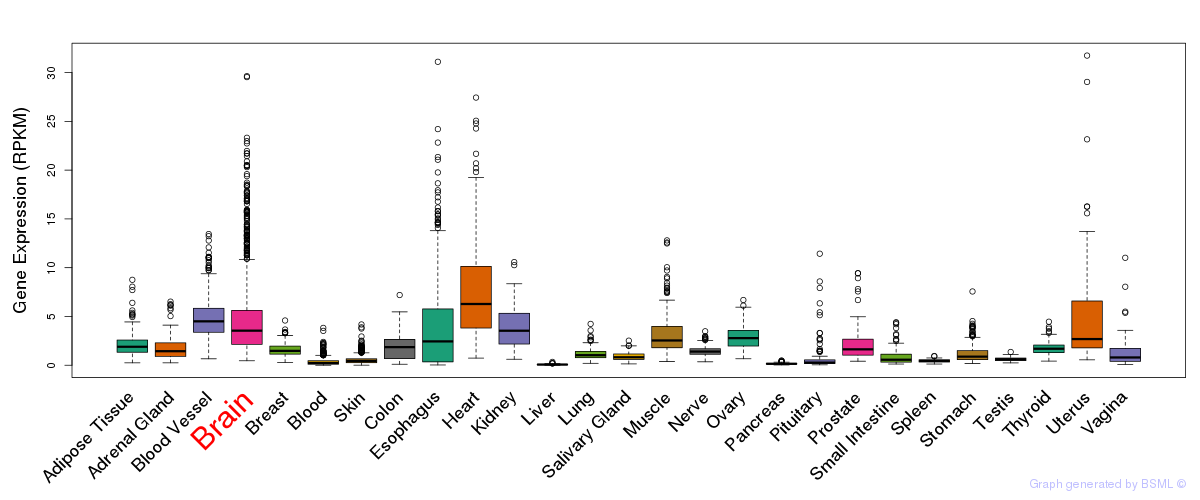
General gene expression (GTEx)
Gene expression during devlopment (BrainCloud)
Footnote:
A total of 269 time points ploted, with n=38 fetal samples (x=1:38). Each triangle represents one time point.
Gene expression of temporal and spatial changes (BrainSpan)
Footnote:
SC: sub-cortical regions; SM: sensory-motor regions; FC: frontal cortex; and TP: temporal-parietal cortex
ST1: fetal (13 - 26 postconception weeks), ST2: early infancy to late childhood (4 months to 11 years), and ST3: adolescence to adulthood (13 - 23 years)
The bar shown representes the lower 25% and upper 25% of the expression distribution.
Top co-expressed genes in brain regions
| Top 10 positively co-expressed genes | ||
| Gene | Pearson's Correlation | Spearman's Correlation |
| ABCB1 | 0.61 | 0.59 |
| ABCG2 | 0.61 | 0.59 |
| SP100 | 0.59 | 0.61 |
| EPAS1 | 0.57 | 0.53 |
| SLC39A8 | 0.56 | 0.61 |
| ALDH1A1 | 0.56 | 0.59 |
| C4orf19 | 0.55 | 0.56 |
| PYGM | 0.55 | 0.54 |
| HLA-E | 0.54 | 0.60 |
| FGR | 0.54 | 0.50 |
| Top 10 negatively co-expressed genes | ||
| Gene | Pearson's Correlation | Spearman's Correlation |
| PODXL2 | -0.49 | -0.54 |
| TTLL1 | -0.48 | -0.55 |
| PARP6 | -0.48 | -0.51 |
| KIAA1543 | -0.48 | -0.55 |
| TMEM63B | -0.47 | -0.52 |
| L1CAM | -0.47 | -0.53 |
| NOVA2 | -0.47 | -0.53 |
| DPF1 | -0.47 | -0.55 |
| YY1AP1 | -0.47 | -0.52 |
| RAB35 | -0.47 | -0.52 |
Section V. Pathway annotation
| Pathway name | Pathway size | # SZGR 2.0 genes in pathway | Info |
|---|---|---|---|
| LIU PROSTATE CANCER DN | 481 | 290 | All SZGR 2.0 genes in this pathway |
| CORRE MULTIPLE MYELOMA DN | 62 | 41 | All SZGR 2.0 genes in this pathway |
| TAKEDA TARGETS OF NUP98 HOXA9 FUSION 6HR UP | 85 | 54 | All SZGR 2.0 genes in this pathway |
| GAUSSMANN MLL AF4 FUSION TARGETS C DN | 19 | 11 | All SZGR 2.0 genes in this pathway |
| FARMER BREAST CANCER APOCRINE VS LUMINAL | 326 | 213 | All SZGR 2.0 genes in this pathway |
| SCHRAMM INHBA TARGETS DN | 24 | 12 | All SZGR 2.0 genes in this pathway |
| BROWNE HCMV INFECTION 20HR UP | 240 | 152 | All SZGR 2.0 genes in this pathway |
| TAKAO RESPONSE TO UVB RADIATION UP | 86 | 55 | All SZGR 2.0 genes in this pathway |
| BROWNE HCMV INFECTION 16HR UP | 225 | 139 | All SZGR 2.0 genes in this pathway |
| CUI TCF21 TARGETS 2 DN | 830 | 547 | All SZGR 2.0 genes in this pathway |
| BROWNE HCMV INFECTION 8HR UP | 105 | 73 | All SZGR 2.0 genes in this pathway |
| BLALOCK ALZHEIMERS DISEASE UP | 1691 | 1088 | All SZGR 2.0 genes in this pathway |
| KAAB HEART ATRIUM VS VENTRICLE DN | 261 | 183 | All SZGR 2.0 genes in this pathway |
| KYNG DNA DAMAGE BY GAMMA AND UV RADIATION | 88 | 65 | All SZGR 2.0 genes in this pathway |
| KYNG DNA DAMAGE UP | 226 | 164 | All SZGR 2.0 genes in this pathway |
| WALLACE PROSTATE CANCER RACE UP | 299 | 167 | All SZGR 2.0 genes in this pathway |
| SMID BREAST CANCER BASAL DN | 701 | 446 | All SZGR 2.0 genes in this pathway |
| ZHAN MULTIPLE MYELOMA PR DN | 44 | 34 | All SZGR 2.0 genes in this pathway |
| SASSON RESPONSE TO GONADOTROPHINS DN | 87 | 66 | All SZGR 2.0 genes in this pathway |
| SASSON RESPONSE TO FORSKOLIN DN | 88 | 68 | All SZGR 2.0 genes in this pathway |
| VERHAAK GLIOBLASTOMA NEURAL | 129 | 85 | All SZGR 2.0 genes in this pathway |
| PURBEY TARGETS OF CTBP1 AND SATB1 DN | 180 | 116 | All SZGR 2.0 genes in this pathway |
| BOSCO ALLERGEN INDUCED TH2 ASSOCIATED MODULE | 151 | 86 | All SZGR 2.0 genes in this pathway |