Gene Page: PLIN1
Summary ?
| GeneID | 5346 |
| Symbol | PLIN1 |
| Synonyms | FPLD4|PERI|PLIN |
| Description | perilipin 1 |
| Reference | MIM:170290|HGNC:HGNC:9076|Ensembl:ENSG00000166819|HPRD:01364|Vega:OTTHUMG00000149813 |
| Gene type | protein-coding |
| Map location | 15q26 |
| Pascal p-value | 0.067 |
| Fetal beta | -0.641 |
| eGene | Myers' cis & trans |
Gene in Data Sources
| Gene set name | Method of gene set | Description | Info |
|---|---|---|---|
| CV:PGCnp | Genome-wide Association Study | GWAS | |
| PMID:cooccur | High-throughput literature-search | Systematic search in PubMed for genes co-occurring with SCZ keywords. A total of 3027 genes were included. | |
| Literature | High-throughput literature-search | Co-occurance with Schizophrenia keywords: schizophrenia,schizophrenias | Click to show details |
Section I. Genetics and epigenetics annotation
 eQTL annotation
| SNP ID | Chromosome | Position | eGene | Gene Entrez ID | pvalue | qvalue | TSS distance | eQTL type |
|---|---|---|---|---|---|---|---|---|
| rs2124228 | chr18 | 11339758 | PLIN1 | 5346 | 0 | trans |
Section II. Transcriptome annotation
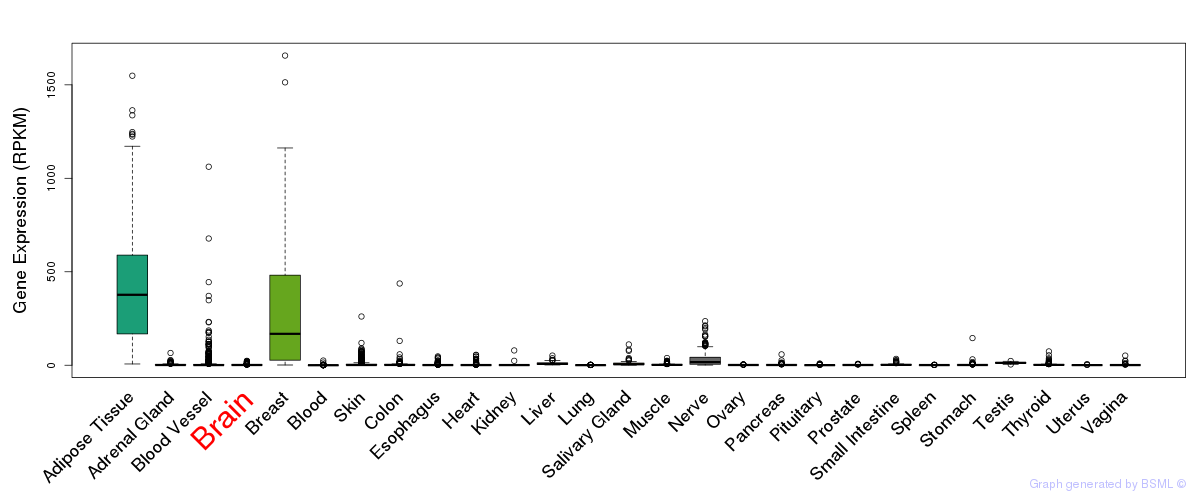
General gene expression (GTEx)
Gene expression during devlopment (BrainCloud)
Footnote:
A total of 269 time points ploted, with n=38 fetal samples (x=1:38). Each triangle represents one time point.
Gene expression of temporal and spatial changes (BrainSpan)
Footnote:
SC: sub-cortical regions; SM: sensory-motor regions; FC: frontal cortex; and TP: temporal-parietal cortex
ST1: fetal (13 - 26 postconception weeks), ST2: early infancy to late childhood (4 months to 11 years), and ST3: adolescence to adulthood (13 - 23 years)
The bar shown representes the lower 25% and upper 25% of the expression distribution.
Top co-expressed genes in brain regions
| Top 10 positively co-expressed genes | ||
| Gene | Pearson's Correlation | Spearman's Correlation |
| WDR75 | 0.91 | 0.91 |
| EFCAB7 | 0.91 | 0.92 |
| DNTTIP2 | 0.91 | 0.93 |
| CWC22 | 0.90 | 0.89 |
| CEBPZ | 0.90 | 0.92 |
| TIGD7 | 0.90 | 0.88 |
| NOP58 | 0.89 | 0.90 |
| NAE1 | 0.89 | 0.91 |
| RINT1 | 0.89 | 0.90 |
| SLC24A5 | 0.88 | 0.89 |
| Top 10 negatively co-expressed genes | ||
| Gene | Pearson's Correlation | Spearman's Correlation |
| HLA-F | -0.69 | -0.76 |
| MT-CO2 | -0.69 | -0.78 |
| AF347015.31 | -0.68 | -0.78 |
| AF347015.27 | -0.68 | -0.76 |
| MT-CYB | -0.68 | -0.78 |
| AF347015.33 | -0.68 | -0.77 |
| AF347015.15 | -0.67 | -0.79 |
| AF347015.2 | -0.67 | -0.81 |
| AF347015.8 | -0.67 | -0.78 |
| TINAGL1 | -0.65 | -0.75 |
Section V. Pathway annotation
| Pathway name | Pathway size | # SZGR 2.0 genes in pathway | Info |
|---|---|---|---|
| KEGG PPAR SIGNALING PATHWAY | 69 | 47 | All SZGR 2.0 genes in this pathway |
| REACTOME DEVELOPMENTAL BIOLOGY | 396 | 292 | All SZGR 2.0 genes in this pathway |
| REACTOME METABOLISM OF LIPIDS AND LIPOPROTEINS | 478 | 302 | All SZGR 2.0 genes in this pathway |
| REACTOME TRANSCRIPTIONAL REGULATION OF WHITE ADIPOCYTE DIFFERENTIATION | 72 | 53 | All SZGR 2.0 genes in this pathway |
| REACTOME HORMONE SENSITIVE LIPASE HSL MEDIATED TRIACYLGLYCEROL HYDROLYSIS | 13 | 11 | All SZGR 2.0 genes in this pathway |
| REACTOME LIPID DIGESTION MOBILIZATION AND TRANSPORT | 46 | 37 | All SZGR 2.0 genes in this pathway |
| VECCHI GASTRIC CANCER EARLY DN | 367 | 220 | All SZGR 2.0 genes in this pathway |
| URS ADIPOCYTE DIFFERENTIATION UP | 74 | 51 | All SZGR 2.0 genes in this pathway |
| SMID BREAST CANCER LUMINAL B DN | 564 | 326 | All SZGR 2.0 genes in this pathway |
| SMID BREAST CANCER LUMINAL A UP | 84 | 52 | All SZGR 2.0 genes in this pathway |
| SMID BREAST CANCER BASAL DN | 701 | 446 | All SZGR 2.0 genes in this pathway |
| WOO LIVER CANCER RECURRENCE DN | 80 | 54 | All SZGR 2.0 genes in this pathway |
| NAKAYAMA SOFT TISSUE TUMORS PCA2 DN | 80 | 51 | All SZGR 2.0 genes in this pathway |
| WAKABAYASHI ADIPOGENESIS PPARG RXRA BOUND 36HR | 152 | 88 | All SZGR 2.0 genes in this pathway |
| WAKABAYASHI ADIPOGENESIS PPARG RXRA BOUND 8D | 882 | 506 | All SZGR 2.0 genes in this pathway |