Gene Page: MTRF1L
Summary ?
| GeneID | 54516 |
| Symbol | MTRF1L |
| Synonyms | HMRF1L|MRF1L|mtRF1a |
| Description | mitochondrial translational release factor 1 like |
| Reference | MIM:613542|HGNC:HGNC:21051|Ensembl:ENSG00000112031|HPRD:17613|Vega:OTTHUMG00000015857 |
| Gene type | protein-coding |
| Map location | 6q25-q26 |
| Pascal p-value | 0.04 |
| Sherlock p-value | 0.856 |
| Fetal beta | -0.169 |
| DMG | 2 (# studies) |
| eGene | Cerebellar Hemisphere Cerebellum Myers' cis & trans Meta |
Gene in Data Sources
| Gene set name | Method of gene set | Description | Info |
|---|---|---|---|
| CV:PGCnp | Genome-wide Association Study | GWAS | |
| DMG:Jaffe_2016 | Genome-wide DNA methylation analysis | This dataset includes 2,104 probes/CpGs associated with SZ patients (n=108) compared to 136 controls at Bonferroni-adjusted P < 0.05. | 3 |
| DMG:Wockner_2014 | Genome-wide DNA methylation analysis | This dataset includes 4641 differentially methylated probes corresponding to 2929 unique genes between schizophrenia patients (n=24) and controls (n=24). | 3 |
Section I. Genetics and epigenetics annotation
 Differentially methylated gene
| Probe | Chromosome | Position | Nearest gene | P (dis) | Beta (dis) | FDR (dis) | Study |
|---|---|---|---|---|---|---|---|
| cg00356818 | 6 | 153324278 | MTRF1L | 4.5E-6 | -0.513 | 0.01 | DMG:Wockner_2014 |
| cg00661010 | 6 | 153323879 | MTRF1L | 1.72E-8 | -0.009 | 6.23E-6 | DMG:Jaffe_2016 |
| cg14265434 | 6 | 153323881 | MTRF1L | 2.15E-8 | -0.01 | 7.29E-6 | DMG:Jaffe_2016 |
eQTL annotation
| SNP ID | Chromosome | Position | eGene | Gene Entrez ID | pvalue | qvalue | TSS distance | eQTL type |
|---|---|---|---|---|---|---|---|---|
| rs9478370 | chr6 | 153276301 | MTRF1L | 54516 | 0.03 | cis | ||
| rs9479452 | chr6 | 153276408 | MTRF1L | 54516 | 0.03 | cis | ||
| rs9478373 | chr6 | 153276725 | MTRF1L | 54516 | 0.03 | cis | ||
| rs6557250 | chr6 | 153279353 | MTRF1L | 54516 | 0 | cis | ||
| rs1712 | chr6 | 153291864 | MTRF1L | 54516 | 0.03 | cis | ||
| rs6929544 | chr6 | 153297149 | MTRF1L | 54516 | 0.01 | cis |
Section II. Transcriptome annotation
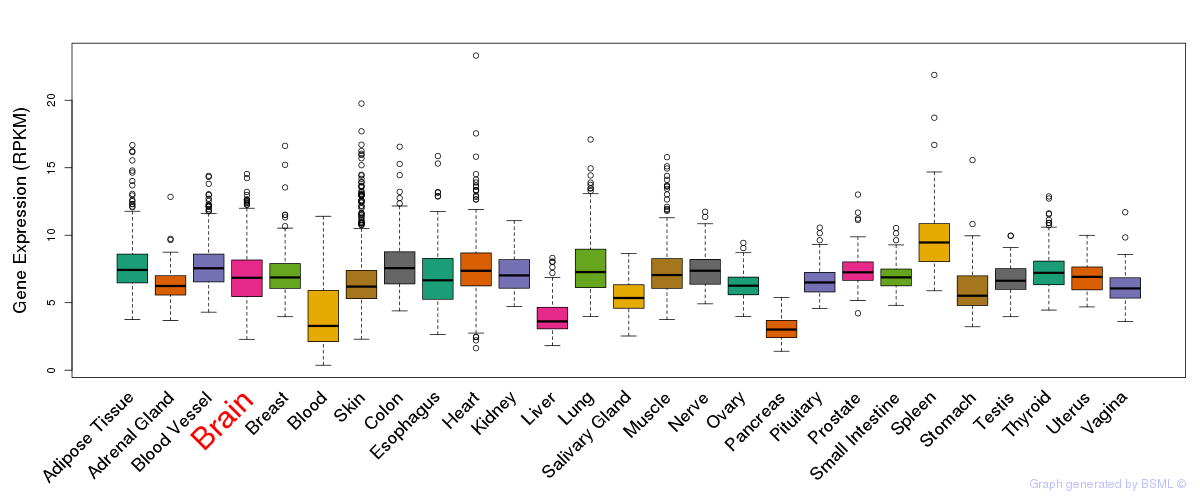
General gene expression (GTEx)
Gene expression during devlopment (BrainCloud)
Footnote:
A total of 269 time points ploted, with n=38 fetal samples (x=1:38). Each triangle represents one time point.
Gene expression of temporal and spatial changes (BrainSpan)
Footnote:
SC: sub-cortical regions; SM: sensory-motor regions; FC: frontal cortex; and TP: temporal-parietal cortex
ST1: fetal (13 - 26 postconception weeks), ST2: early infancy to late childhood (4 months to 11 years), and ST3: adolescence to adulthood (13 - 23 years)
The bar shown representes the lower 25% and upper 25% of the expression distribution.
No co-expressed genes in brain regions
Section V. Pathway annotation
| Pathway name | Pathway size | # SZGR 2.0 genes in pathway | Info |
|---|---|---|---|
| KIM WT1 TARGETS 8HR DN | 129 | 84 | All SZGR 2.0 genes in this pathway |
| CHOI ATL STAGE PREDICTOR | 44 | 24 | All SZGR 2.0 genes in this pathway |
| LIANG HEMATOPOIESIS STEM CELL NUMBER LARGE VS TINY DN | 45 | 24 | All SZGR 2.0 genes in this pathway |
| RICKMAN TUMOR DIFFERENTIATED WELL VS POORLY DN | 382 | 224 | All SZGR 2.0 genes in this pathway |
| MARSON BOUND BY FOXP3 STIMULATED | 1022 | 619 | All SZGR 2.0 genes in this pathway |
| YOSHIMURA MAPK8 TARGETS UP | 1305 | 895 | All SZGR 2.0 genes in this pathway |
| ROME INSULIN TARGETS IN MUSCLE UP | 442 | 263 | All SZGR 2.0 genes in this pathway |
| YAGI AML WITH INV 16 TRANSLOCATION | 422 | 277 | All SZGR 2.0 genes in this pathway |
| MARTENS BOUND BY PML RARA FUSION | 456 | 287 | All SZGR 2.0 genes in this pathway |
| MARTENS TRETINOIN RESPONSE DN | 841 | 431 | All SZGR 2.0 genes in this pathway |
| VANOEVELEN MYOGENESIS SIN3A TARGETS | 220 | 133 | All SZGR 2.0 genes in this pathway |
| ZWANG TRANSIENTLY UP BY 1ST EGF PULSE ONLY | 1839 | 928 | All SZGR 2.0 genes in this pathway |