Gene Page: KLHL28
Summary ?
| GeneID | 54813 |
| Symbol | KLHL28 |
| Synonyms | BTBD5 |
| Description | kelch like family member 28 |
| Reference | HGNC:HGNC:19741|Ensembl:ENSG00000179454|HPRD:12539|Vega:OTTHUMG00000140263 |
| Gene type | protein-coding |
| Map location | 14q21.2 |
| Pascal p-value | 0.129 |
| Sherlock p-value | 0.036 |
| Fetal beta | 1.179 |
| eGene | Putamen basal ganglia Myers' cis & trans |
Gene in Data Sources
| Gene set name | Method of gene set | Description | Info |
|---|---|---|---|
| CV:PGCnp | Genome-wide Association Study | GWAS |
Section I. Genetics and epigenetics annotation
 eQTL annotation
| SNP ID | Chromosome | Position | eGene | Gene Entrez ID | pvalue | qvalue | TSS distance | eQTL type |
|---|---|---|---|---|---|---|---|---|
| rs3769467 | chr2 | 201205340 | KLHL28 | 54813 | 0.02 | trans | ||
| rs3769461 | chr2 | 201222657 | KLHL28 | 54813 | 0.02 | trans | ||
| rs4985452 | chr16 | 69945140 | KLHL28 | 54813 | 0.16 | trans | ||
| rs17114670 | 14 | 44511930 | KLHL28 | ENSG00000179454.9 | 1.38128E-7 | 0 | 999595 | gtex_brain_putamen_basal |
| rs74048411 | 14 | 44522162 | KLHL28 | ENSG00000179454.9 | 1.92048E-8 | 0 | 989363 | gtex_brain_putamen_basal |
| rs8013660 | 14 | 44531428 | KLHL28 | ENSG00000179454.9 | 1.92598E-8 | 0 | 980097 | gtex_brain_putamen_basal |
| rs74048412 | 14 | 44532999 | KLHL28 | ENSG00000179454.9 | 1.92598E-8 | 0 | 978526 | gtex_brain_putamen_basal |
| rs34530912 | 14 | 44535203 | KLHL28 | ENSG00000179454.9 | 1.9315E-8 | 0 | 976322 | gtex_brain_putamen_basal |
| rs10484233 | 14 | 44539717 | KLHL28 | ENSG00000179454.9 | 1.92048E-8 | 0 | 971808 | gtex_brain_putamen_basal |
Section II. Transcriptome annotation
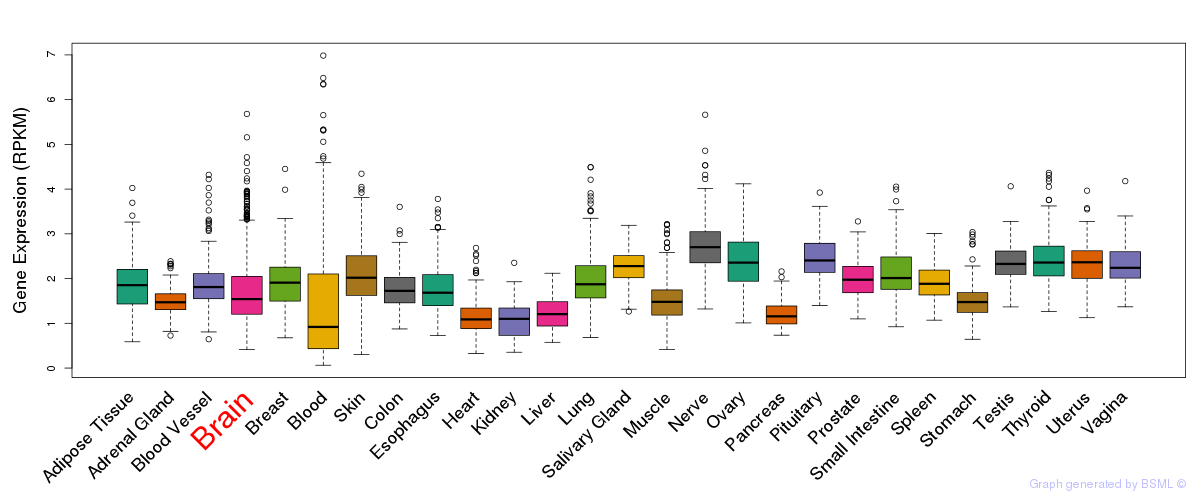
General gene expression (GTEx)
Gene expression during devlopment (BrainCloud)
Footnote:
A total of 269 time points ploted, with n=38 fetal samples (x=1:38). Each triangle represents one time point.
Gene expression of temporal and spatial changes (BrainSpan)
Footnote:
SC: sub-cortical regions; SM: sensory-motor regions; FC: frontal cortex; and TP: temporal-parietal cortex
ST1: fetal (13 - 26 postconception weeks), ST2: early infancy to late childhood (4 months to 11 years), and ST3: adolescence to adulthood (13 - 23 years)
The bar shown representes the lower 25% and upper 25% of the expression distribution.
No co-expressed genes in brain regions
Section V. Pathway annotation
| Pathway name | Pathway size | # SZGR 2.0 genes in pathway | Info |
|---|---|---|---|
| NAKAMURA TUMOR ZONE PERIPHERAL VS CENTRAL DN | 634 | 384 | All SZGR 2.0 genes in this pathway |
| ZHOU INFLAMMATORY RESPONSE LIVE UP | 485 | 293 | All SZGR 2.0 genes in this pathway |
| CHARAFE BREAST CANCER LUMINAL VS MESENCHYMAL UP | 450 | 256 | All SZGR 2.0 genes in this pathway |
| GARGALOVIC RESPONSE TO OXIDIZED PHOSPHOLIPIDS BLUE UP | 136 | 80 | All SZGR 2.0 genes in this pathway |
| SENESE HDAC3 TARGETS UP | 501 | 327 | All SZGR 2.0 genes in this pathway |
| ZHOU INFLAMMATORY RESPONSE FIMA UP | 544 | 308 | All SZGR 2.0 genes in this pathway |
| PEREZ TP53 TARGETS | 1174 | 695 | All SZGR 2.0 genes in this pathway |
| ZHAN MULTIPLE MYELOMA CD1 AND CD2 UP | 89 | 51 | All SZGR 2.0 genes in this pathway |
| SATO SILENCED BY METHYLATION IN PANCREATIC CANCER 1 | 419 | 273 | All SZGR 2.0 genes in this pathway |
| WANG SMARCE1 TARGETS UP | 280 | 183 | All SZGR 2.0 genes in this pathway |
| DOUGLAS BMI1 TARGETS DN | 314 | 188 | All SZGR 2.0 genes in this pathway |
| TAVAZOIE METASTASIS | 108 | 68 | All SZGR 2.0 genes in this pathway |
| CHANDRAN METASTASIS UP | 221 | 135 | All SZGR 2.0 genes in this pathway |
| PECE MAMMARY STEM CELL DN | 146 | 88 | All SZGR 2.0 genes in this pathway |
| ZWANG TRANSIENTLY UP BY 1ST EGF PULSE ONLY | 1839 | 928 | All SZGR 2.0 genes in this pathway |