Gene Page: GIN1
Summary ?
| GeneID | 54826 |
| Symbol | GIN1 |
| Synonyms | GIN-1|TGIN1|ZH2C2 |
| Description | gypsy retrotransposon integrase 1 |
| Reference | HGNC:HGNC:25959|Ensembl:ENSG00000145723|HPRD:07878|Vega:OTTHUMG00000162811 |
| Gene type | protein-coding |
| Map location | 5q21.1 |
| Pascal p-value | 0.324 |
| DMG | 1 (# studies) |
Gene in Data Sources
| Gene set name | Method of gene set | Description | Info |
|---|---|---|---|
| CV:GWASdb | Genome-wide Association Studies | GWASdb records for schizophrenia | |
| CV:PGCnp | Genome-wide Association Study | GWAS | |
| DMG:Jaffe_2016 | Genome-wide DNA methylation analysis | This dataset includes 2,104 probes/CpGs associated with SZ patients (n=108) compared to 136 controls at Bonferroni-adjusted P < 0.05. | 1 |
Section I. Genetics and epigenetics annotation
 Differentially methylated gene
| Probe | Chromosome | Position | Nearest gene | P (dis) | Beta (dis) | FDR (dis) | Study |
|---|---|---|---|---|---|---|---|
| cg05452345 | 5 | 102455768 | GIN1 | 2.97E-8 | 0.006 | 9.11E-6 | DMG:Jaffe_2016 |
Section II. Transcriptome annotation
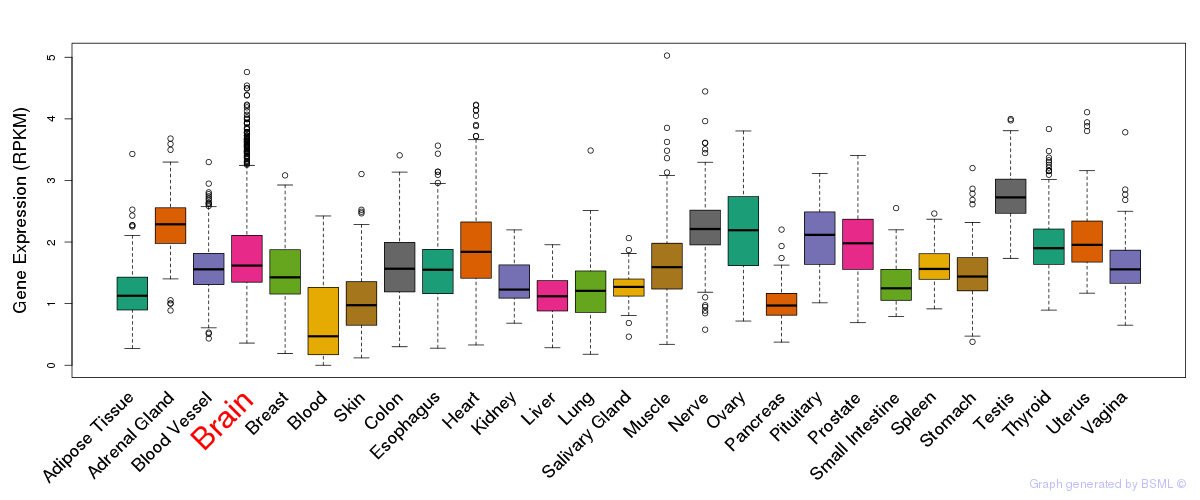
General gene expression (GTEx)
Gene expression of temporal and spatial changes (BrainSpan)
Footnote:
SC: sub-cortical regions; SM: sensory-motor regions; FC: frontal cortex; and TP: temporal-parietal cortex
ST1: fetal (13 - 26 postconception weeks), ST2: early infancy to late childhood (4 months to 11 years), and ST3: adolescence to adulthood (13 - 23 years)
The bar shown representes the lower 25% and upper 25% of the expression distribution.
Top co-expressed genes in brain regions
| Top 10 positively co-expressed genes | ||
| Gene | Pearson's Correlation | Spearman's Correlation |
| MON1A | 0.86 | 0.81 |
| MCAT | 0.86 | 0.82 |
| APBB1 | 0.85 | 0.84 |
| TBRG4 | 0.85 | 0.82 |
| RTN2 | 0.84 | 0.82 |
| MCOLN1 | 0.84 | 0.85 |
| PRAF2 | 0.84 | 0.85 |
| PPP5C | 0.83 | 0.82 |
| RABGGTA | 0.83 | 0.81 |
| STK25 | 0.83 | 0.78 |
| Top 10 negatively co-expressed genes | ||
| Gene | Pearson's Correlation | Spearman's Correlation |
| AF347015.8 | -0.65 | -0.56 |
| AF347015.26 | -0.64 | -0.57 |
| AF347015.2 | -0.63 | -0.54 |
| AL139819.3 | -0.62 | -0.62 |
| AF347015.33 | -0.62 | -0.54 |
| AF347015.18 | -0.62 | -0.63 |
| MT-CO2 | -0.62 | -0.51 |
| AF347015.15 | -0.61 | -0.51 |
| MT-CYB | -0.61 | -0.52 |
| MT-ATP8 | -0.61 | -0.57 |
Section V. Pathway annotation
| Pathway name | Pathway size | # SZGR 2.0 genes in pathway | Info |
|---|---|---|---|
| RODRIGUES THYROID CARCINOMA POORLY DIFFERENTIATED UP | 633 | 376 | All SZGR 2.0 genes in this pathway |
| SCHAEFFER PROSTATE DEVELOPMENT 6HR UP | 176 | 115 | All SZGR 2.0 genes in this pathway |
| SHEN SMARCA2 TARGETS UP | 424 | 268 | All SZGR 2.0 genes in this pathway |
| IVANOVA HEMATOPOIESIS LATE PROGENITOR | 544 | 307 | All SZGR 2.0 genes in this pathway |