Gene Page: ZCCHC2
Summary ?
| GeneID | 54877 |
| Symbol | ZCCHC2 |
| Synonyms | C18orf49 |
| Description | zinc finger CCHC-type containing 2 |
| Reference | HGNC:HGNC:22916|Ensembl:ENSG00000141664|HPRD:11696|Vega:OTTHUMG00000180165 |
| Gene type | protein-coding |
| Map location | 18q21.33 |
| Pascal p-value | 0.061 |
| Fetal beta | -0.747 |
| eGene | Cerebellar Hemisphere |
Gene in Data Sources
| Gene set name | Method of gene set | Description | Info |
|---|---|---|---|
| CV:GWAScat | Genome-wide Association Studies | This data set includes 560 SNPs associated with schizophrenia. A total of 486 genes were mapped to these SNPs within 50kb. | |
| CV:PGCnp | Genome-wide Association Study | GWAS |
Section I. Genetics and epigenetics annotation
Section II. Transcriptome annotation
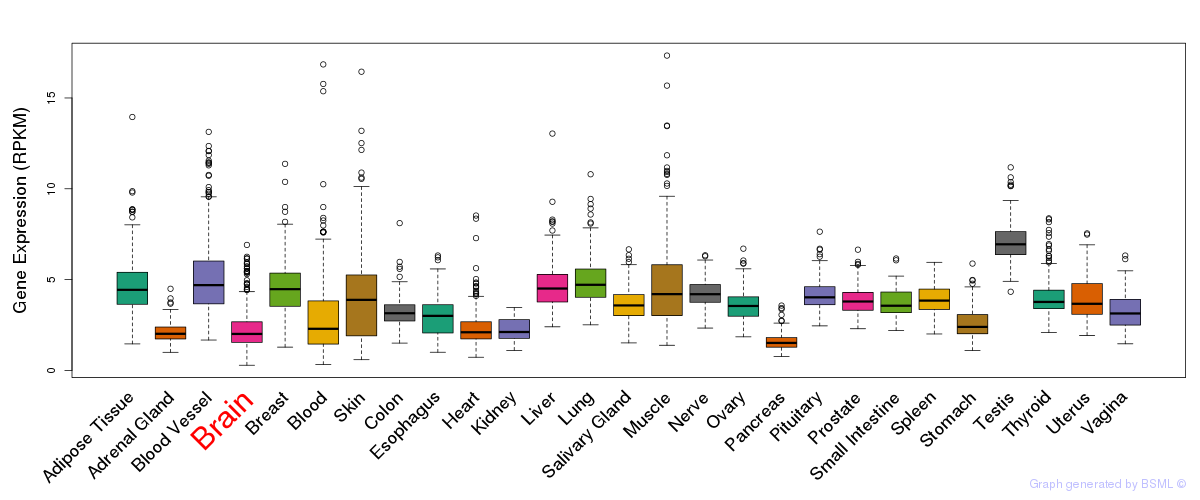
General gene expression (GTEx)
Gene expression during devlopment (BrainCloud)
Footnote:
A total of 269 time points ploted, with n=38 fetal samples (x=1:38). Each triangle represents one time point.
Gene expression of temporal and spatial changes (BrainSpan)
Footnote:
SC: sub-cortical regions; SM: sensory-motor regions; FC: frontal cortex; and TP: temporal-parietal cortex
ST1: fetal (13 - 26 postconception weeks), ST2: early infancy to late childhood (4 months to 11 years), and ST3: adolescence to adulthood (13 - 23 years)
The bar shown representes the lower 25% and upper 25% of the expression distribution.
Top co-expressed genes in brain regions
| Top 10 positively co-expressed genes | ||
| Gene | Pearson's Correlation | Spearman's Correlation |
| DUOX1 | 0.83 | 0.76 |
| MYO9B | 0.82 | 0.88 |
| KIAA1530 | 0.81 | 0.74 |
| PROM2 | 0.81 | 0.74 |
| AC103810.3 | 0.81 | 0.77 |
| GIGYF1 | 0.81 | 0.77 |
| CCDC57 | 0.81 | 0.69 |
| AC018638.5 | 0.80 | 0.77 |
| AC005197.4 | 0.80 | 0.68 |
| PLEKHM1P | 0.80 | 0.75 |
| Top 10 negatively co-expressed genes | ||
| Gene | Pearson's Correlation | Spearman's Correlation |
| SNX3 | -0.40 | -0.48 |
| MGST2 | -0.40 | -0.48 |
| ACOT13 | -0.40 | -0.43 |
| CHPT1 | -0.39 | -0.48 |
| COX5B | -0.39 | -0.52 |
| CISD1 | -0.38 | -0.46 |
| ITM2B | -0.38 | -0.41 |
| NDUFB5 | -0.38 | -0.53 |
| GMFG | -0.38 | -0.54 |
| NDUFS3 | -0.38 | -0.55 |
Section V. Pathway annotation
| Pathway name | Pathway size | # SZGR 2.0 genes in pathway | Info |
|---|---|---|---|
| DEURIG T CELL PROLYMPHOCYTIC LEUKEMIA DN | 320 | 184 | All SZGR 2.0 genes in this pathway |
| GARGALOVIC RESPONSE TO OXIDIZED PHOSPHOLIPIDS TURQUOISE UP | 79 | 50 | All SZGR 2.0 genes in this pathway |
| KIM WT1 TARGETS DN | 459 | 276 | All SZGR 2.0 genes in this pathway |
| GAUSSMANN MLL AF4 FUSION TARGETS G DN | 35 | 18 | All SZGR 2.0 genes in this pathway |
| HAMAI APOPTOSIS VIA TRAIL UP | 584 | 356 | All SZGR 2.0 genes in this pathway |
| NUYTTEN EZH2 TARGETS UP | 1037 | 673 | All SZGR 2.0 genes in this pathway |
| PASQUALUCCI LYMPHOMA BY GC STAGE DN | 165 | 104 | All SZGR 2.0 genes in this pathway |
| BENPORATH EED TARGETS | 1062 | 725 | All SZGR 2.0 genes in this pathway |
| ALCALAY AML BY NPM1 LOCALIZATION UP | 140 | 83 | All SZGR 2.0 genes in this pathway |
| ACEVEDO METHYLATED IN LIVER CANCER DN | 940 | 425 | All SZGR 2.0 genes in this pathway |
| LINSLEY MIR16 TARGETS | 206 | 127 | All SZGR 2.0 genes in this pathway |
| PURBEY TARGETS OF CTBP1 NOT SATB1 DN | 448 | 282 | All SZGR 2.0 genes in this pathway |
| ZWANG TRANSIENTLY UP BY 1ST EGF PULSE ONLY | 1839 | 928 | All SZGR 2.0 genes in this pathway |