Gene Page: C1orf123
Summary ?
| GeneID | 54987 |
| Symbol | C1orf123 |
| Synonyms | - |
| Description | chromosome 1 open reading frame 123 |
| Reference | HGNC:HGNC:26059|Ensembl:ENSG00000162384|HPRD:07929|Vega:OTTHUMG00000008940 |
| Gene type | protein-coding |
| Map location | 1p32.3 |
| Pascal p-value | 0.007 |
| Sherlock p-value | 0.503 |
| Fetal beta | -0.235 |
| DMG | 1 (# studies) |
| eGene | Cerebellum Hypothalamus Myers' cis & trans Meta |
Gene in Data Sources
| Gene set name | Method of gene set | Description | Info |
|---|---|---|---|
| CV:PGCnp | Genome-wide Association Study | GWAS | |
| DMG:Jaffe_2016 | Genome-wide DNA methylation analysis | This dataset includes 2,104 probes/CpGs associated with SZ patients (n=108) compared to 136 controls at Bonferroni-adjusted P < 0.05. | 1 |
Section I. Genetics and epigenetics annotation
 Differentially methylated gene
| Probe | Chromosome | Position | Nearest gene | P (dis) | Beta (dis) | FDR (dis) | Study |
|---|---|---|---|---|---|---|---|
| cg07249409 | 1 | 53686008 | C1orf123 | 1.38E-8 | -0.013 | 5.41E-6 | DMG:Jaffe_2016 |
eQTL annotation
| SNP ID | Chromosome | Position | eGene | Gene Entrez ID | pvalue | qvalue | TSS distance | eQTL type |
|---|---|---|---|---|---|---|---|---|
| rs11206127 | chr1 | 53713548 | C1orf123 | 54987 | 0.16 | cis | ||
| rs869987 | chr1 | 53723189 | C1orf123 | 54987 | 0.15 | cis | ||
| rs869988 | chr1 | 53723348 | C1orf123 | 54987 | 0.12 | cis | ||
| rs2297657 | chr1 | 53746594 | C1orf123 | 54987 | 0.02 | cis | ||
| rs4623641 | chr1 | 53751609 | C1orf123 | 54987 | 0.13 | cis |
Section II. Transcriptome annotation
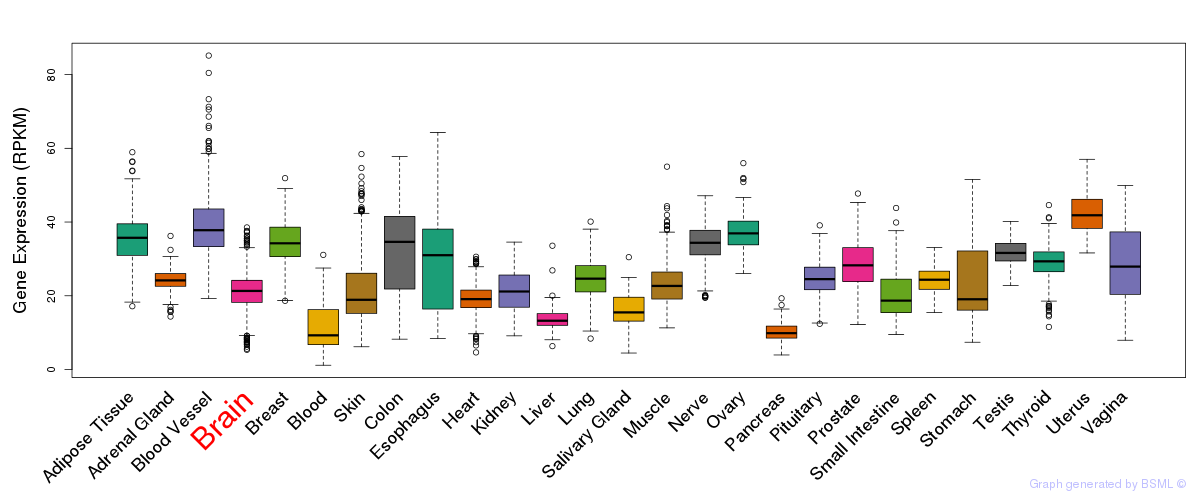
General gene expression (GTEx)
Gene expression during devlopment (BrainCloud)
Footnote:
A total of 269 time points ploted, with n=38 fetal samples (x=1:38). Each triangle represents one time point.
Gene expression of temporal and spatial changes (BrainSpan)
Footnote:
SC: sub-cortical regions; SM: sensory-motor regions; FC: frontal cortex; and TP: temporal-parietal cortex
ST1: fetal (13 - 26 postconception weeks), ST2: early infancy to late childhood (4 months to 11 years), and ST3: adolescence to adulthood (13 - 23 years)
The bar shown representes the lower 25% and upper 25% of the expression distribution.
Top co-expressed genes in brain regions
| Top 10 positively co-expressed genes | ||
| Gene | Pearson's Correlation | Spearman's Correlation |
| MLC1 | 0.81 | 0.79 |
| TTYH1 | 0.78 | 0.77 |
| BCAN | 0.76 | 0.74 |
| NKAIN4 | 0.76 | 0.74 |
| LRP10 | 0.76 | 0.77 |
| PPAP2B | 0.76 | 0.71 |
| COMT | 0.75 | 0.76 |
| S1PR1 | 0.75 | 0.75 |
| FIBIN | 0.75 | 0.68 |
| IL33 | 0.73 | 0.63 |
| Top 10 negatively co-expressed genes | ||
| Gene | Pearson's Correlation | Spearman's Correlation |
| PRDM2 | -0.46 | -0.50 |
| FBXW7 | -0.46 | -0.53 |
| KIAA1841 | -0.45 | -0.51 |
| MYSM1 | -0.44 | -0.48 |
| ARHGAP20 | -0.44 | -0.48 |
| MYT1L | -0.43 | -0.47 |
| UBP1 | -0.43 | -0.50 |
| ANK3 | -0.43 | -0.46 |
| ELMOD1 | -0.43 | -0.47 |
| ZC3H8 | -0.42 | -0.48 |
Section V. Pathway annotation
| Pathway name | Pathway size | # SZGR 2.0 genes in pathway | Info |
|---|---|---|---|
| GRAESSMANN APOPTOSIS BY SERUM DEPRIVATION DN | 234 | 147 | All SZGR 2.0 genes in this pathway |
| GRAESSMANN APOPTOSIS BY DOXORUBICIN DN | 1781 | 1082 | All SZGR 2.0 genes in this pathway |
| GRAESSMANN RESPONSE TO MC AND DOXORUBICIN DN | 770 | 415 | All SZGR 2.0 genes in this pathway |
| LASTOWSKA NEUROBLASTOMA COPY NUMBER DN | 800 | 473 | All SZGR 2.0 genes in this pathway |
| DACOSTA UV RESPONSE VIA ERCC3 UP | 309 | 199 | All SZGR 2.0 genes in this pathway |
| STARK PREFRONTAL CORTEX 22Q11 DELETION DN | 517 | 309 | All SZGR 2.0 genes in this pathway |
| BROWNE HCMV INFECTION 14HR DN | 298 | 200 | All SZGR 2.0 genes in this pathway |
| BROWNE HCMV INFECTION 18HR DN | 178 | 121 | All SZGR 2.0 genes in this pathway |
| KIM BIPOLAR DISORDER OLIGODENDROCYTE DENSITY CORR UP | 682 | 440 | All SZGR 2.0 genes in this pathway |
| PILON KLF1 TARGETS DN | 1972 | 1213 | All SZGR 2.0 genes in this pathway |
| BRUINS UVC RESPONSE LATE | 1137 | 655 | All SZGR 2.0 genes in this pathway |