Gene Page: GOLPH3L
Summary ?
| GeneID | 55204 |
| Symbol | GOLPH3L |
| Synonyms | GPP34R |
| Description | golgi phosphoprotein 3 like |
| Reference | MIM:612208|HGNC:HGNC:24882|Ensembl:ENSG00000143457|HPRD:17048|Vega:OTTHUMG00000035009 |
| Gene type | protein-coding |
| Map location | 1q21.3 |
| Sherlock p-value | 1.549E-5 |
| Fetal beta | -0.91 |
| eGene | Myers' cis & trans |
Gene in Data Sources
| Gene set name | Method of gene set | Description | Info |
|---|---|---|---|
| CV:PGCnp | Genome-wide Association Study | GWAS | |
| GSMA_I | Genome scan meta-analysis | Psr: 0.0235 | |
| GSMA_IIA | Genome scan meta-analysis (All samples) | Psr: 0.00814 |
Section I. Genetics and epigenetics annotation
 eQTL annotation
| SNP ID | Chromosome | Position | eGene | Gene Entrez ID | pvalue | qvalue | TSS distance | eQTL type |
|---|---|---|---|---|---|---|---|---|
| rs13023481 | chr2 | 213839772 | GOLPH3L | 55204 | 0.13 | trans |
Section II. Transcriptome annotation
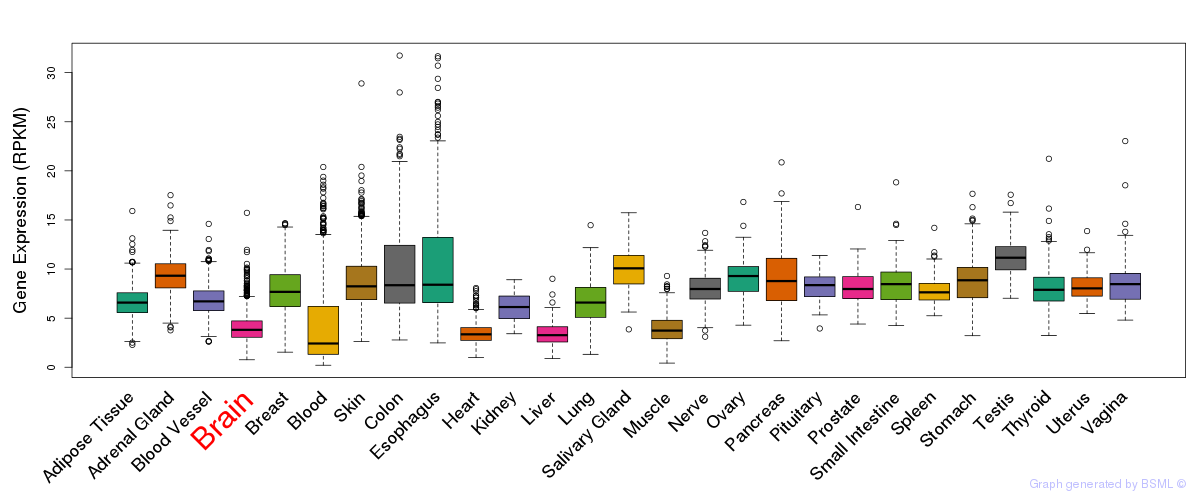
General gene expression (GTEx)
Gene expression during devlopment (BrainCloud)
Footnote:
A total of 269 time points ploted, with n=38 fetal samples (x=1:38). Each triangle represents one time point.
Gene expression of temporal and spatial changes (BrainSpan)
Footnote:
SC: sub-cortical regions; SM: sensory-motor regions; FC: frontal cortex; and TP: temporal-parietal cortex
ST1: fetal (13 - 26 postconception weeks), ST2: early infancy to late childhood (4 months to 11 years), and ST3: adolescence to adulthood (13 - 23 years)
The bar shown representes the lower 25% and upper 25% of the expression distribution.
No co-expressed genes in brain regions
Section III. Gene Ontology annotation
| Cellular component | GO term | Evidence | Neuro keywords | PubMed ID |
|---|---|---|---|---|
| GO:0005794 | Golgi apparatus | IEA | - | |
| GO:0005737 | cytoplasm | IEA | - | |
| GO:0016020 | membrane | IEA | - |
Section V. Pathway annotation
| Pathway name | Pathway size | # SZGR 2.0 genes in pathway | Info |
|---|---|---|---|
| FOURNIER ACINAR DEVELOPMENT EARLY UP | 21 | 19 | All SZGR 2.0 genes in this pathway |
| ZHONG RESPONSE TO AZACITIDINE AND TSA DN | 70 | 38 | All SZGR 2.0 genes in this pathway |
| KIM WT1 TARGETS DN | 459 | 276 | All SZGR 2.0 genes in this pathway |
| AUNG GASTRIC CANCER | 54 | 20 | All SZGR 2.0 genes in this pathway |
| BUYTAERT PHOTODYNAMIC THERAPY STRESS UP | 811 | 508 | All SZGR 2.0 genes in this pathway |
| WEI MIR34A TARGETS | 148 | 97 | All SZGR 2.0 genes in this pathway |
| KOYAMA SEMA3B TARGETS DN | 411 | 249 | All SZGR 2.0 genes in this pathway |
| DOUGLAS BMI1 TARGETS DN | 314 | 188 | All SZGR 2.0 genes in this pathway |
| CREIGHTON ENDOCRINE THERAPY RESISTANCE 3 | 720 | 440 | All SZGR 2.0 genes in this pathway |
| PELLICCIOTTA HDAC IN ANTIGEN PRESENTATION UP | 64 | 40 | All SZGR 2.0 genes in this pathway |
| MARSON BOUND BY FOXP3 STIMULATED | 1022 | 619 | All SZGR 2.0 genes in this pathway |
| MARSON BOUND BY FOXP3 UNSTIMULATED | 1229 | 713 | All SZGR 2.0 genes in this pathway |
| ACEVEDO LIVER CANCER UP | 973 | 570 | All SZGR 2.0 genes in this pathway |
| ACEVEDO LIVER TUMOR VS NORMAL ADJACENT TISSUE UP | 863 | 514 | All SZGR 2.0 genes in this pathway |
| MIKKELSEN ES ICP WITH H3K4ME3 | 718 | 401 | All SZGR 2.0 genes in this pathway |
| MIKKELSEN NPC ICP WITH H3K4ME3 | 445 | 257 | All SZGR 2.0 genes in this pathway |
| GOBERT OLIGODENDROCYTE DIFFERENTIATION DN | 1080 | 713 | All SZGR 2.0 genes in this pathway |
| PHONG TNF RESPONSE VIA P38 COMPLETE | 227 | 151 | All SZGR 2.0 genes in this pathway |
| LIM MAMMARY STEM CELL DN | 428 | 246 | All SZGR 2.0 genes in this pathway |
| SMIRNOV RESPONSE TO IR 2HR DN | 55 | 35 | All SZGR 2.0 genes in this pathway |
| ZWANG TRANSIENTLY UP BY 1ST EGF PULSE ONLY | 1839 | 928 | All SZGR 2.0 genes in this pathway |
Section VI. microRNA annotation
| miRNA family | Target position | miRNA ID | miRNA seq | ||
|---|---|---|---|---|---|
| UTR start | UTR end | Match method | |||
| miR-155 | 724 | 730 | m8 | hsa-miR-155 | UUAAUGCUAAUCGUGAUAGGGG |
- SZ: miRNAs which differentially expressed in brain cortex of schizophrenia patients comparing with control samples using microarray. Click here to see the list of SZ related miRNAs.
- Brain: miRNAs which are expressed in brain based on miRNA microarray expression studies. Click here to see the list of brain related miRNAs.