Gene Page: TMEM144
Summary ?
| GeneID | 55314 |
| Symbol | TMEM144 |
| Synonyms | - |
| Description | transmembrane protein 144 |
| Reference | HGNC:HGNC:25633|Ensembl:ENSG00000164124|HPRD:07736|Vega:OTTHUMG00000162013 |
| Gene type | protein-coding |
| Map location | 4q32.1 |
| Pascal p-value | 0.8 |
| Fetal beta | -2.731 |
| DMG | 1 (# studies) |
| eGene | Myers' cis & trans |
Gene in Data Sources
| Gene set name | Method of gene set | Description | Info |
|---|---|---|---|
| CV:PGCnp | Genome-wide Association Study | GWAS | |
| DMG:Wockner_2014 | Genome-wide DNA methylation analysis | This dataset includes 4641 differentially methylated probes corresponding to 2929 unique genes between schizophrenia patients (n=24) and controls (n=24). | 1 |
| Expression | Meta-analysis of gene expression | P value: 1.387 |
Section I. Genetics and epigenetics annotation
 Differentially methylated gene
| Probe | Chromosome | Position | Nearest gene | P (dis) | Beta (dis) | FDR (dis) | Study |
|---|---|---|---|---|---|---|---|
| ch.4.2906511F | 4 | 159141944 | TMEM144 | 2.956E-4 | -0.727 | 0.039 | DMG:Wockner_2014 |
eQTL annotation
| SNP ID | Chromosome | Position | eGene | Gene Entrez ID | pvalue | qvalue | TSS distance | eQTL type |
|---|---|---|---|---|---|---|---|---|
| rs1497561 | chr4 | 46081561 | TMEM144 | 55314 | 0.08 | trans | ||
| rs6878840 | chr5 | 16377301 | TMEM144 | 55314 | 0.05 | trans | ||
| rs16868576 | chr5 | 16409288 | TMEM144 | 55314 | 0.05 | trans | ||
| rs2701519 | chr15 | 37408650 | TMEM144 | 55314 | 0.06 | trans | ||
| rs5975741 | chrX | 135599018 | TMEM144 | 55314 | 0.02 | trans |
Section II. Transcriptome annotation
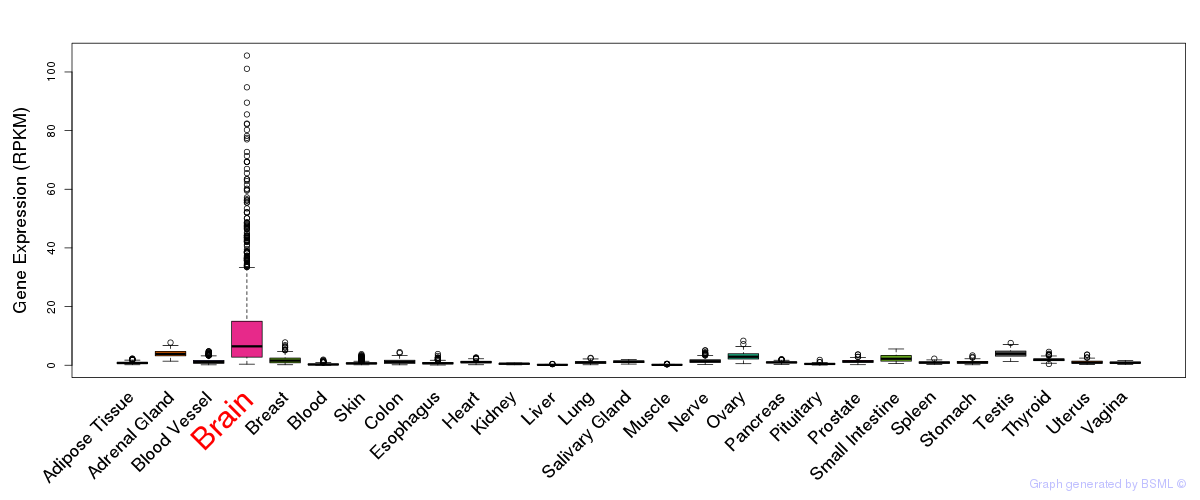
General gene expression (GTEx)
Gene expression during devlopment (BrainCloud)
Footnote:
A total of 269 time points ploted, with n=38 fetal samples (x=1:38). Each triangle represents one time point.
Gene expression of temporal and spatial changes (BrainSpan)
Footnote:
SC: sub-cortical regions; SM: sensory-motor regions; FC: frontal cortex; and TP: temporal-parietal cortex
ST1: fetal (13 - 26 postconception weeks), ST2: early infancy to late childhood (4 months to 11 years), and ST3: adolescence to adulthood (13 - 23 years)
The bar shown representes the lower 25% and upper 25% of the expression distribution.
No co-expressed genes in brain regions
Section III. Gene Ontology annotation
| Cellular component | GO term | Evidence | Neuro keywords | PubMed ID |
|---|---|---|---|---|
| GO:0016020 | membrane | IEA | - | |
| GO:0016021 | integral to membrane | IEA | - |
Section V. Pathway annotation
| Pathway name | Pathway size | # SZGR 2.0 genes in pathway | Info |
|---|---|---|---|
| GRAESSMANN APOPTOSIS BY DOXORUBICIN DN | 1781 | 1082 | All SZGR 2.0 genes in this pathway |
| GAUSSMANN MLL AF4 FUSION TARGETS G UP | 238 | 135 | All SZGR 2.0 genes in this pathway |
| DARWICHE SKIN TUMOR PROMOTER DN | 185 | 115 | All SZGR 2.0 genes in this pathway |
| DARWICHE PAPILLOMA RISK LOW DN | 165 | 107 | All SZGR 2.0 genes in this pathway |
| DARWICHE PAPILLOMA RISK HIGH DN | 180 | 110 | All SZGR 2.0 genes in this pathway |
| DARWICHE SQUAMOUS CELL CARCINOMA DN | 181 | 107 | All SZGR 2.0 genes in this pathway |
| PEREZ TP53 TARGETS | 1174 | 695 | All SZGR 2.0 genes in this pathway |
| IVANOVA HEMATOPOIESIS STEM CELL LONG TERM | 302 | 191 | All SZGR 2.0 genes in this pathway |
| DOUGLAS BMI1 TARGETS DN | 314 | 188 | All SZGR 2.0 genes in this pathway |
| ACEVEDO LIVER CANCER WITH H3K27ME3 UP | 295 | 149 | All SZGR 2.0 genes in this pathway |
| CHEN METABOLIC SYNDROM NETWORK | 1210 | 725 | All SZGR 2.0 genes in this pathway |
| VERHAAK GLIOBLASTOMA NEURAL | 129 | 85 | All SZGR 2.0 genes in this pathway |
| WANG RESPONSE TO GSK3 INHIBITOR SB216763 UP | 397 | 206 | All SZGR 2.0 genes in this pathway |
| CHYLA CBFA2T3 TARGETS UP | 387 | 225 | All SZGR 2.0 genes in this pathway |