Gene Page: AP1AR
Summary ?
| GeneID | 55435 |
| Symbol | AP1AR |
| Synonyms | 2C18|C4orf16|GBAR|PRO0971|gamma-BAR |
| Description | adaptor related protein complex 1 associated regulatory protein |
| Reference | MIM:610851|HGNC:HGNC:28808|Ensembl:ENSG00000138660|HPRD:12824|Vega:OTTHUMG00000132849 |
| Gene type | protein-coding |
| Map location | 4q25 |
| Pascal p-value | 0.698 |
| Sherlock p-value | 0.197 |
| Fetal beta | 0.535 |
| DMG | 1 (# studies) |
| eGene | Myers' cis & trans |
Gene in Data Sources
| Gene set name | Method of gene set | Description | Info |
|---|---|---|---|
| CV:PGCnp | Genome-wide Association Study | GWAS | |
| DMG:Jaffe_2016 | Genome-wide DNA methylation analysis | This dataset includes 2,104 probes/CpGs associated with SZ patients (n=108) compared to 136 controls at Bonferroni-adjusted P < 0.05. | 1 |
Section I. Genetics and epigenetics annotation
 Differentially methylated gene
| Probe | Chromosome | Position | Nearest gene | P (dis) | Beta (dis) | FDR (dis) | Study |
|---|---|---|---|---|---|---|---|
| cg25884040 | 4 | 113152634 | AP1AR | 3.15E-9 | -0.016 | 2.12E-6 | DMG:Jaffe_2016 |
eQTL annotation
| SNP ID | Chromosome | Position | eGene | Gene Entrez ID | pvalue | qvalue | TSS distance | eQTL type |
|---|---|---|---|---|---|---|---|---|
| rs12326929 | chr18 | 70864592 | AP1AR | 55435 | 0.19 | trans |
Section II. Transcriptome annotation
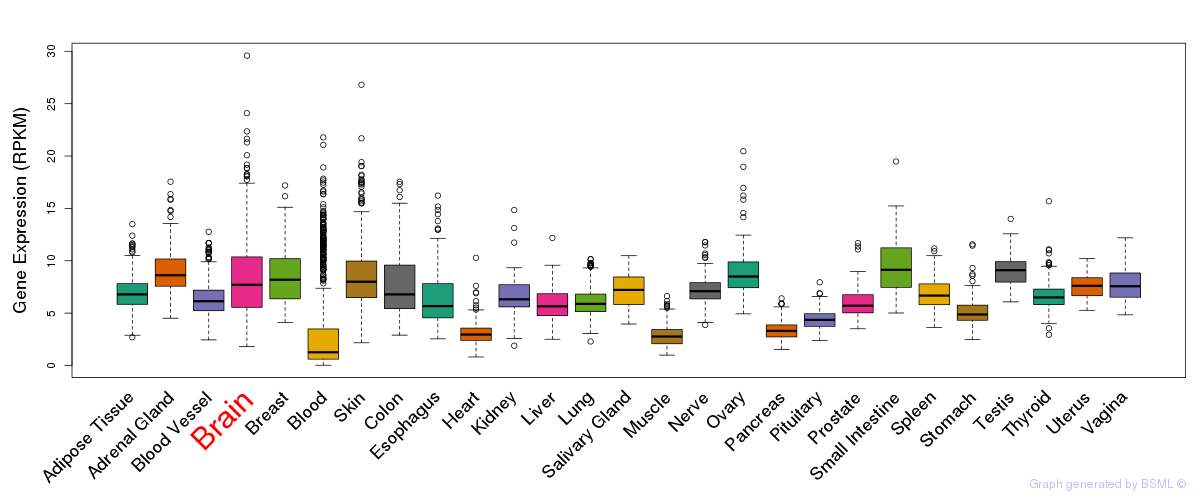
General gene expression (GTEx)
Gene expression during devlopment (BrainCloud)
Footnote:
A total of 269 time points ploted, with n=38 fetal samples (x=1:38). Each triangle represents one time point.
Gene expression of temporal and spatial changes (BrainSpan)
Footnote:
SC: sub-cortical regions; SM: sensory-motor regions; FC: frontal cortex; and TP: temporal-parietal cortex
ST1: fetal (13 - 26 postconception weeks), ST2: early infancy to late childhood (4 months to 11 years), and ST3: adolescence to adulthood (13 - 23 years)
The bar shown representes the lower 25% and upper 25% of the expression distribution.
Top co-expressed genes in brain regions
| Top 10 positively co-expressed genes | ||
| Gene | Pearson's Correlation | Spearman's Correlation |
| LRRFIP1 | 0.80 | 0.81 |
| CLIP1 | 0.78 | 0.80 |
| PLEKHA5 | 0.78 | 0.77 |
| TAOK3 | 0.77 | 0.80 |
| TPR | 0.77 | 0.79 |
| LRRFIP2 | 0.77 | 0.75 |
| SLTM | 0.76 | 0.77 |
| ZC3H13 | 0.75 | 0.75 |
| SENP6 | 0.75 | 0.75 |
| ZNF638 | 0.75 | 0.76 |
| Top 10 negatively co-expressed genes | ||
| Gene | Pearson's Correlation | Spearman's Correlation |
| AF347015.21 | -0.60 | -0.58 |
| ENHO | -0.60 | -0.66 |
| IFI27 | -0.59 | -0.58 |
| MT-CO2 | -0.58 | -0.58 |
| AF347015.31 | -0.58 | -0.58 |
| VAMP5 | -0.57 | -0.59 |
| AF347015.27 | -0.57 | -0.56 |
| HIGD1B | -0.57 | -0.58 |
| MYL3 | -0.56 | -0.58 |
| C1orf54 | -0.56 | -0.59 |
Section V. Pathway annotation
| Pathway name | Pathway size | # SZGR 2.0 genes in pathway | Info |
|---|---|---|---|
| GINESTIER BREAST CANCER 20Q13 AMPLIFICATION UP | 119 | 66 | All SZGR 2.0 genes in this pathway |
| SENESE HDAC3 TARGETS UP | 501 | 327 | All SZGR 2.0 genes in this pathway |
| RODRIGUES THYROID CARCINOMA POORLY DIFFERENTIATED UP | 633 | 376 | All SZGR 2.0 genes in this pathway |
| HAMAI APOPTOSIS VIA TRAIL UP | 584 | 356 | All SZGR 2.0 genes in this pathway |
| FARMER BREAST CANCER BASAL VS LULMINAL | 330 | 215 | All SZGR 2.0 genes in this pathway |
| NUYTTEN NIPP1 TARGETS UP | 769 | 437 | All SZGR 2.0 genes in this pathway |
| NUYTTEN EZH2 TARGETS UP | 1037 | 673 | All SZGR 2.0 genes in this pathway |
| BUYTAERT PHOTODYNAMIC THERAPY STRESS UP | 811 | 508 | All SZGR 2.0 genes in this pathway |
| MONNIER POSTRADIATION TUMOR ESCAPE UP | 393 | 244 | All SZGR 2.0 genes in this pathway |
| RIGGINS TAMOXIFEN RESISTANCE DN | 220 | 147 | All SZGR 2.0 genes in this pathway |