Gene Page: ELMOD1
Summary ?
| GeneID | 55531 |
| Symbol | ELMOD1 |
| Synonyms | - |
| Description | ELMO domain containing 1 |
| Reference | MIM:615456|HGNC:HGNC:25334|Ensembl:ENSG00000110675|HPRD:10934|Vega:OTTHUMG00000166361 |
| Gene type | protein-coding |
| Map location | 11q22.3 |
| Pascal p-value | 0.417 |
| Sherlock p-value | 0.932 |
| Fetal beta | 0.049 |
| DMG | 1 (# studies) |
Gene in Data Sources
| Gene set name | Method of gene set | Description | Info |
|---|---|---|---|
| CV:PGCnp | Genome-wide Association Study | GWAS | |
| DMG:Jaffe_2016 | Genome-wide DNA methylation analysis | This dataset includes 2,104 probes/CpGs associated with SZ patients (n=108) compared to 136 controls at Bonferroni-adjusted P < 0.05. | 1 |
| GSMA_I | Genome scan meta-analysis | Psr: 0.006 |
Section I. Genetics and epigenetics annotation
 Differentially methylated gene
| Probe | Chromosome | Position | Nearest gene | P (dis) | Beta (dis) | FDR (dis) | Study |
|---|---|---|---|---|---|---|---|
| cg27064125 | 11 | 107461225 | ELMOD1 | 3.23E-9 | -0.016 | 2.16E-6 | DMG:Jaffe_2016 |
Section II. Transcriptome annotation
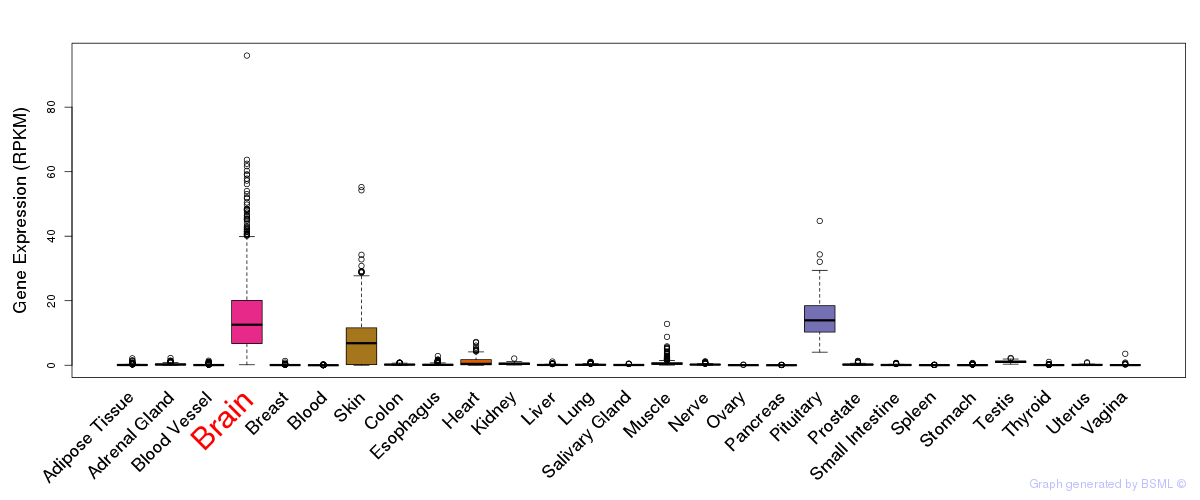
General gene expression (GTEx)
Gene expression during devlopment (BrainCloud)
Footnote:
A total of 269 time points ploted, with n=38 fetal samples (x=1:38). Each triangle represents one time point.
Gene expression of temporal and spatial changes (BrainSpan)
Footnote:
SC: sub-cortical regions; SM: sensory-motor regions; FC: frontal cortex; and TP: temporal-parietal cortex
ST1: fetal (13 - 26 postconception weeks), ST2: early infancy to late childhood (4 months to 11 years), and ST3: adolescence to adulthood (13 - 23 years)
The bar shown representes the lower 25% and upper 25% of the expression distribution.
Top co-expressed genes in brain regions
| Top 10 positively co-expressed genes | ||
| Gene | Pearson's Correlation | Spearman's Correlation |
| TTC17 | 0.95 | 0.95 |
| MED23 | 0.94 | 0.95 |
| TOPBP1 | 0.93 | 0.94 |
| ZNF45 | 0.93 | 0.92 |
| WDR5 | 0.93 | 0.93 |
| ZC3H7A | 0.93 | 0.93 |
| HP1BP3 | 0.93 | 0.95 |
| SMEK1 | 0.93 | 0.94 |
| RNASEN | 0.92 | 0.93 |
| TSR1 | 0.92 | 0.93 |
| Top 10 negatively co-expressed genes | ||
| Gene | Pearson's Correlation | Spearman's Correlation |
| AF347015.31 | -0.83 | -0.89 |
| MT-CO2 | -0.82 | -0.90 |
| AF347015.27 | -0.80 | -0.86 |
| MT-CYB | -0.79 | -0.87 |
| AF347015.8 | -0.79 | -0.89 |
| AF347015.33 | -0.79 | -0.85 |
| FXYD1 | -0.78 | -0.85 |
| IFI27 | -0.77 | -0.85 |
| AF347015.15 | -0.76 | -0.86 |
| HIGD1B | -0.76 | -0.85 |
Section III. Gene Ontology annotation
| Biological process | GO term | Evidence | Neuro keywords | PubMed ID |
|---|---|---|---|---|
| GO:0006909 | phagocytosis | IEA | - | |
| Cellular component | GO term | Evidence | Neuro keywords | PubMed ID |
| GO:0005856 | cytoskeleton | IEA | - |
Section V. Pathway annotation
| Pathway name | Pathway size | # SZGR 2.0 genes in pathway | Info |
|---|---|---|---|
| SENESE HDAC1 AND HDAC2 TARGETS UP | 238 | 144 | All SZGR 2.0 genes in this pathway |
| PEREZ TP53 TARGETS | 1174 | 695 | All SZGR 2.0 genes in this pathway |
| PEREZ TP63 TARGETS | 355 | 243 | All SZGR 2.0 genes in this pathway |
| PEREZ TP53 AND TP63 TARGETS | 205 | 145 | All SZGR 2.0 genes in this pathway |
| BENPORATH SUZ12 TARGETS | 1038 | 678 | All SZGR 2.0 genes in this pathway |
| BENPORATH EED TARGETS | 1062 | 725 | All SZGR 2.0 genes in this pathway |
| BENPORATH ES WITH H3K27ME3 | 1118 | 744 | All SZGR 2.0 genes in this pathway |
| BENPORATH PRC2 TARGETS | 652 | 441 | All SZGR 2.0 genes in this pathway |
| LEE TARGETS OF PTCH1 AND SUFU DN | 83 | 69 | All SZGR 2.0 genes in this pathway |
| IVANOVA HEMATOPOIESIS LATE PROGENITOR | 544 | 307 | All SZGR 2.0 genes in this pathway |
| KONDO PROSTATE CANCER WITH H3K27ME3 | 196 | 93 | All SZGR 2.0 genes in this pathway |
| ACEVEDO LIVER CANCER WITH H3K27ME3 UP | 295 | 149 | All SZGR 2.0 genes in this pathway |
| MEISSNER NPC HCP WITH H3K4ME3 AND H3K27ME3 | 142 | 103 | All SZGR 2.0 genes in this pathway |
Section VI. microRNA annotation
| miRNA family | Target position | miRNA ID | miRNA seq | ||
|---|---|---|---|---|---|
| UTR start | UTR end | Match method | |||
| miR-141/200a | 218 | 225 | 1A,m8 | hsa-miR-141 | UAACACUGUCUGGUAAAGAUGG |
| hsa-miR-200a | UAACACUGUCUGGUAACGAUGU | ||||
| miR-143 | 129 | 135 | m8 | hsa-miR-143brain | UGAGAUGAAGCACUGUAGCUCA |
| miR-200bc/429 | 1477 | 1483 | 1A | hsa-miR-200b | UAAUACUGCCUGGUAAUGAUGAC |
| hsa-miR-200c | UAAUACUGCCGGGUAAUGAUGG | ||||
| hsa-miR-429 | UAAUACUGUCUGGUAAAACCGU | ||||
| miR-34/449 | 34 | 40 | m8 | hsa-miR-34abrain | UGGCAGUGUCUUAGCUGGUUGUU |
| hsa-miR-34c | AGGCAGUGUAGUUAGCUGAUUGC | ||||
| hsa-miR-449 | UGGCAGUGUAUUGUUAGCUGGU | ||||
| hsa-miR-449b | AGGCAGUGUAUUGUUAGCUGGC | ||||
| miR-34b | 35 | 41 | m8 | hsa-miR-34b | UAGGCAGUGUCAUUAGCUGAUUG |
| hsa-miR-34b | UAGGCAGUGUCAUUAGCUGAUUG | ||||
| miR-369-3p | 1478 | 1484 | m8 | hsa-miR-369-3p | AAUAAUACAUGGUUGAUCUUU |
| miR-505 | 1411 | 1417 | 1A | hsa-miR-505 | GUCAACACUUGCUGGUUUCCUC |
- SZ: miRNAs which differentially expressed in brain cortex of schizophrenia patients comparing with control samples using microarray. Click here to see the list of SZ related miRNAs.
- Brain: miRNAs which are expressed in brain based on miRNA microarray expression studies. Click here to see the list of brain related miRNAs.