Gene Page: PRR5
Summary ?
| GeneID | 55615 |
| Symbol | PRR5 |
| Synonyms | FLJ20185k|PP610|PROTOR-1|PROTOR1 |
| Description | proline rich 5 |
| Reference | MIM:609406|HGNC:HGNC:31682|Ensembl:ENSG00000186654|HPRD:18696|Vega:OTTHUMG00000150460 |
| Gene type | protein-coding |
| Map location | 22q13 |
| Pascal p-value | 0.141 |
| Fetal beta | 0.374 |
| DMG | 1 (# studies) |
Gene in Data Sources
| Gene set name | Method of gene set | Description | Info |
|---|---|---|---|
| CV:PGCnp | Genome-wide Association Study | GWAS | |
| DMG:vanEijk_2014 | Genome-wide DNA methylation analysis | This dataset includes 432 differentially methylated CpG sites corresponding to 391 unique transcripts between schizophrenia patients (n=260) and unaffected controls (n=250). | 2 |
Section I. Genetics and epigenetics annotation
 Differentially methylated gene
| Probe | Chromosome | Position | Nearest gene | P (dis) | Beta (dis) | FDR (dis) | Study |
|---|---|---|---|---|---|---|---|
| cg13757640 | 22 | 45148888 | PRR5 | 0.003 | 11.635 | DMG:vanEijk_2014 | |
| cg13757640 | 22 | 45148888 | PRR5 | 0.004 | 11.408 | DMG:vanEijk_2014 |
Section II. Transcriptome annotation
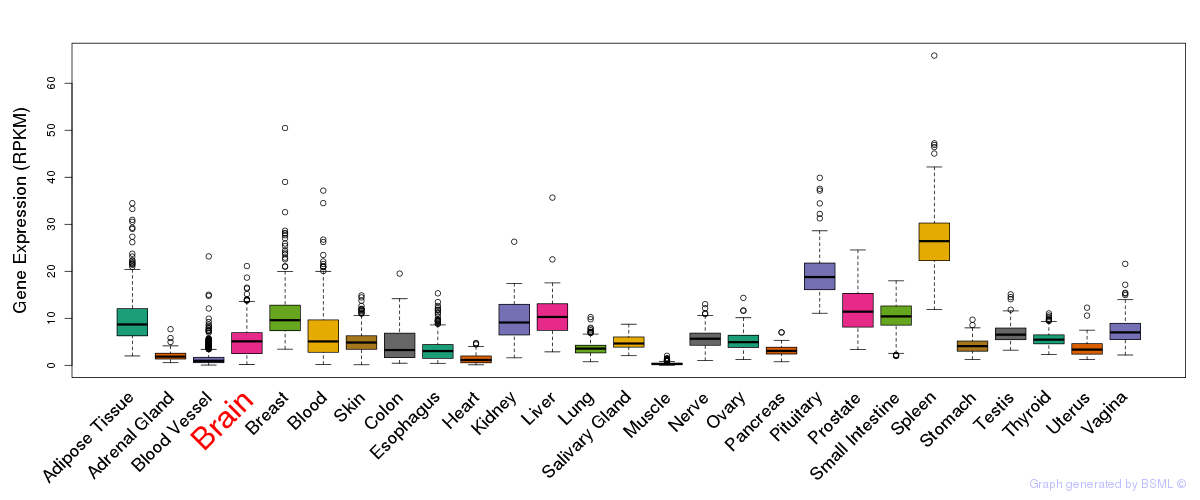
General gene expression (GTEx)
Gene expression during devlopment (BrainCloud)
Footnote:
A total of 269 time points ploted, with n=38 fetal samples (x=1:38). Each triangle represents one time point.
Gene expression of temporal and spatial changes (BrainSpan)
Footnote:
SC: sub-cortical regions; SM: sensory-motor regions; FC: frontal cortex; and TP: temporal-parietal cortex
ST1: fetal (13 - 26 postconception weeks), ST2: early infancy to late childhood (4 months to 11 years), and ST3: adolescence to adulthood (13 - 23 years)
The bar shown representes the lower 25% and upper 25% of the expression distribution.
Top co-expressed genes in brain regions
| Top 10 positively co-expressed genes | ||
| Gene | Pearson's Correlation | Spearman's Correlation |
| SEMA3G | 0.87 | 0.89 |
| ENG | 0.84 | 0.85 |
| SLCO2B1 | 0.83 | 0.85 |
| VWF | 0.83 | 0.87 |
| TGM2 | 0.83 | 0.85 |
| ITIH5 | 0.82 | 0.84 |
| CD34 | 0.81 | 0.82 |
| SHE | 0.81 | 0.83 |
| CDH5 | 0.81 | 0.83 |
| SLC2A1 | 0.80 | 0.81 |
| Top 10 negatively co-expressed genes | ||
| Gene | Pearson's Correlation | Spearman's Correlation |
| ZNF32 | -0.62 | -0.66 |
| NDUFAF2 | -0.61 | -0.66 |
| C8orf59 | -0.61 | -0.66 |
| OXSM | -0.59 | -0.63 |
| PPP2R3C | -0.58 | -0.63 |
| FRG1 | -0.58 | -0.62 |
| MTIF3 | -0.58 | -0.59 |
| COMMD3 | -0.57 | -0.60 |
| C12orf45 | -0.57 | -0.63 |
| CWC15 | -0.56 | -0.60 |
Section V. Pathway annotation
| Pathway name | Pathway size | # SZGR 2.0 genes in pathway | Info |
|---|---|---|---|
| PID MTOR 4PATHWAY | 69 | 55 | All SZGR 2.0 genes in this pathway |
| HOOI ST7 TARGETS UP | 94 | 57 | All SZGR 2.0 genes in this pathway |
| KIM WT1 TARGETS UP | 214 | 155 | All SZGR 2.0 genes in this pathway |
| DODD NASOPHARYNGEAL CARCINOMA DN | 1375 | 806 | All SZGR 2.0 genes in this pathway |
| KOYAMA SEMA3B TARGETS UP | 292 | 168 | All SZGR 2.0 genes in this pathway |
| BURTON ADIPOGENESIS 2 | 72 | 52 | All SZGR 2.0 genes in this pathway |
| IVANOVA HEMATOPOIESIS STEM CELL AND PROGENITOR | 681 | 420 | All SZGR 2.0 genes in this pathway |
| BURTON ADIPOGENESIS PEAK AT 8HR | 39 | 31 | All SZGR 2.0 genes in this pathway |
| BILD MYC ONCOGENIC SIGNATURE | 206 | 117 | All SZGR 2.0 genes in this pathway |
| KRIGE RESPONSE TO TOSEDOSTAT 6HR DN | 911 | 527 | All SZGR 2.0 genes in this pathway |
| KRIGE RESPONSE TO TOSEDOSTAT 24HR DN | 1011 | 592 | All SZGR 2.0 genes in this pathway |
| MEISSNER BRAIN HCP WITH H3K27ME3 | 269 | 159 | All SZGR 2.0 genes in this pathway |
| MEISSNER NPC HCP WITH H3K4ME2 | 491 | 319 | All SZGR 2.0 genes in this pathway |
| WHITFIELD CELL CYCLE G2 M | 216 | 124 | All SZGR 2.0 genes in this pathway |
| MARTENS TRETINOIN RESPONSE UP | 857 | 456 | All SZGR 2.0 genes in this pathway |
| DUTERTRE ESTRADIOL RESPONSE 24HR DN | 505 | 328 | All SZGR 2.0 genes in this pathway |
| BHAT ESR1 TARGETS NOT VIA AKT1 UP | 211 | 131 | All SZGR 2.0 genes in this pathway |
| BHAT ESR1 TARGETS VIA AKT1 UP | 281 | 183 | All SZGR 2.0 genes in this pathway |