Gene Page: LIMS2
Summary ?
| GeneID | 55679 |
| Symbol | LIMS2 |
| Synonyms | LGMD2W|PINCH-2|PINCH2 |
| Description | LIM zinc finger domain containing 2 |
| Reference | MIM:607908|HGNC:HGNC:16084|Ensembl:ENSG00000072163|Vega:OTTHUMG00000131529 |
| Gene type | protein-coding |
| Map location | 2q14.3 |
| Pascal p-value | 0.517 |
| Sherlock p-value | 9.247E-4 |
| Fetal beta | -1.044 |
| DMG | 1 (# studies) |
| eGene | Meta |
Gene in Data Sources
| Gene set name | Method of gene set | Description | Info |
|---|---|---|---|
| CV:PGCnp | Genome-wide Association Study | GWAS | |
| DMG:Wockner_2014 | Genome-wide DNA methylation analysis | This dataset includes 4641 differentially methylated probes corresponding to 2929 unique genes between schizophrenia patients (n=24) and controls (n=24). | 1 |
| GSMA_I | Genome scan meta-analysis | Psr: 0.023 | |
| GSMA_IIA | Genome scan meta-analysis (All samples) | Psr: 0.00755 |
Section I. Genetics and epigenetics annotation
 Differentially methylated gene
| Probe | Chromosome | Position | Nearest gene | P (dis) | Beta (dis) | FDR (dis) | Study |
|---|---|---|---|---|---|---|---|
| cg21339084 | 2 | 128422433 | LIMS2 | 5.757E-4 | 0.24 | 0.049 | DMG:Wockner_2014 |
Section II. Transcriptome annotation
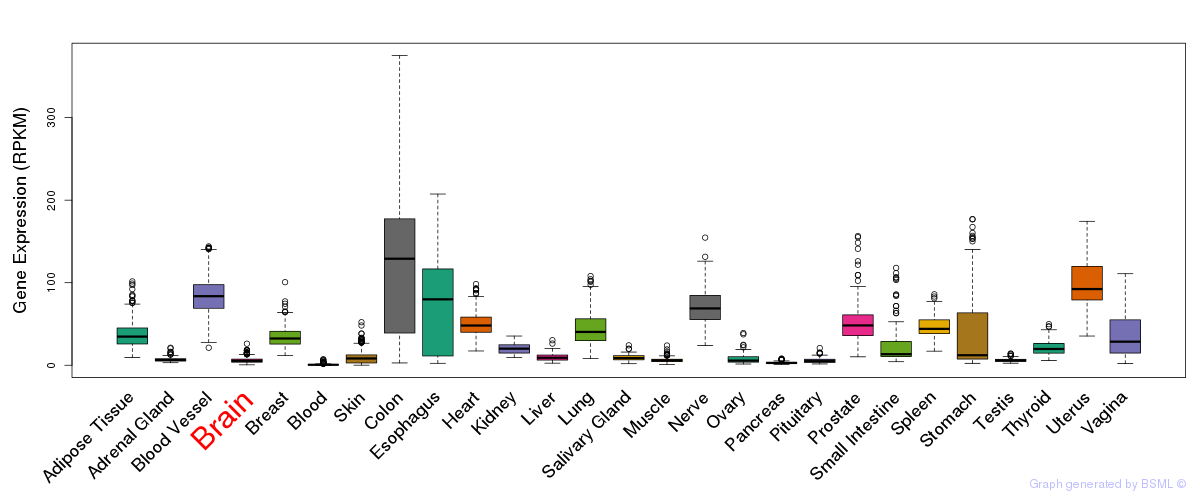
General gene expression (GTEx)
Gene expression during devlopment (BrainCloud)
Footnote:
A total of 269 time points ploted, with n=38 fetal samples (x=1:38). Each triangle represents one time point.
Gene expression of temporal and spatial changes (BrainSpan)
Footnote:
SC: sub-cortical regions; SM: sensory-motor regions; FC: frontal cortex; and TP: temporal-parietal cortex
ST1: fetal (13 - 26 postconception weeks), ST2: early infancy to late childhood (4 months to 11 years), and ST3: adolescence to adulthood (13 - 23 years)
The bar shown representes the lower 25% and upper 25% of the expression distribution.
Top co-expressed genes in brain regions
| Top 10 positively co-expressed genes | ||
| Gene | Pearson's Correlation | Spearman's Correlation |
| NUP50 | 0.91 | 0.91 |
| USP7 | 0.90 | 0.89 |
| RABEP1 | 0.90 | 0.91 |
| ADSS | 0.90 | 0.89 |
| MORC3 | 0.89 | 0.91 |
| FBXO11 | 0.89 | 0.91 |
| RAB14 | 0.89 | 0.90 |
| UBP1 | 0.89 | 0.89 |
| EHBP1 | 0.89 | 0.90 |
| CUL1 | 0.89 | 0.89 |
| Top 10 negatively co-expressed genes | ||
| Gene | Pearson's Correlation | Spearman's Correlation |
| MT-CO2 | -0.77 | -0.74 |
| AF347015.31 | -0.76 | -0.75 |
| HIGD1B | -0.76 | -0.77 |
| FXYD1 | -0.76 | -0.76 |
| AF347015.21 | -0.74 | -0.71 |
| IFI27 | -0.74 | -0.75 |
| MT-CYB | -0.73 | -0.71 |
| AF347015.8 | -0.73 | -0.72 |
| AF347015.33 | -0.73 | -0.70 |
| AF347015.2 | -0.72 | -0.70 |
Section III. Gene Ontology annotation
| Molecular function | GO term | Evidence | Neuro keywords | PubMed ID |
|---|---|---|---|---|
| GO:0008270 | zinc ion binding | IEA | - | |
| GO:0046872 | metal ion binding | IEA | - | |
| Cellular component | GO term | Evidence | Neuro keywords | PubMed ID |
| GO:0005634 | nucleus | IEA | - | |
| GO:0005886 | plasma membrane | IEA | - | |
| GO:0030054 | cell junction | IEA | - |
Section V. Pathway annotation
| Pathway name | Pathway size | # SZGR 2.0 genes in pathway | Info |
|---|---|---|---|
| PID ILK PATHWAY | 45 | 32 | All SZGR 2.0 genes in this pathway |
| BERTUCCI MEDULLARY VS DUCTAL BREAST CANCER DN | 169 | 118 | All SZGR 2.0 genes in this pathway |
| PEREZ TP63 TARGETS | 355 | 243 | All SZGR 2.0 genes in this pathway |
| SCHAEFFER PROSTATE DEVELOPMENT 12HR DN | 57 | 45 | All SZGR 2.0 genes in this pathway |
| JEPSEN SMRT TARGETS | 33 | 23 | All SZGR 2.0 genes in this pathway |
| CAIRO HEPATOBLASTOMA CLASSES DN | 210 | 141 | All SZGR 2.0 genes in this pathway |
| CHANDRAN METASTASIS DN | 306 | 191 | All SZGR 2.0 genes in this pathway |
| SENGUPTA EBNA1 ANTICORRELATED | 173 | 85 | All SZGR 2.0 genes in this pathway |
| CHICAS RB1 TARGETS CONFLUENT | 567 | 365 | All SZGR 2.0 genes in this pathway |
| GOBERT OLIGODENDROCYTE DIFFERENTIATION DN | 1080 | 713 | All SZGR 2.0 genes in this pathway |
| BOUDOUKHA BOUND BY IGF2BP2 | 111 | 59 | All SZGR 2.0 genes in this pathway |
| ACEVEDO FGFR1 TARGETS IN PROSTATE CANCER MODEL DN | 308 | 187 | All SZGR 2.0 genes in this pathway |
| LIM MAMMARY STEM CELL UP | 489 | 314 | All SZGR 2.0 genes in this pathway |
Section VI. microRNA annotation
| miRNA family | Target position | miRNA ID | miRNA seq | ||
|---|---|---|---|---|---|
| UTR start | UTR end | Match method | |||
| miR-205 | 836 | 842 | m8 | hsa-miR-205 | UCCUUCAUUCCACCGGAGUCUG |
- SZ: miRNAs which differentially expressed in brain cortex of schizophrenia patients comparing with control samples using microarray. Click here to see the list of SZ related miRNAs.
- Brain: miRNAs which are expressed in brain based on miRNA microarray expression studies. Click here to see the list of brain related miRNAs.