Gene Page: VAC14
Summary ?
| GeneID | 55697 |
| Symbol | VAC14 |
| Synonyms | ArPIKfyve|TAX1BP2|TRX |
| Description | Vac14 homolog (S. cerevisiae) |
| Reference | MIM:604632|HGNC:HGNC:25507|Ensembl:ENSG00000103043|HPRD:07660|Vega:OTTHUMG00000137583 |
| Gene type | protein-coding |
| Map location | 16q22.1 |
| Pascal p-value | 0.1 |
| Sherlock p-value | 0.029 |
| Fetal beta | -0.426 |
| DMG | 1 (# studies) |
| eGene | Myers' cis & trans |
Gene in Data Sources
| Gene set name | Method of gene set | Description | Info |
|---|---|---|---|
| CV:PGCnp | Genome-wide Association Study | GWAS | |
| DMG:Jaffe_2016 | Genome-wide DNA methylation analysis | This dataset includes 2,104 probes/CpGs associated with SZ patients (n=108) compared to 136 controls at Bonferroni-adjusted P < 0.05. | 1 |
Section I. Genetics and epigenetics annotation
 Differentially methylated gene
| Probe | Chromosome | Position | Nearest gene | P (dis) | Beta (dis) | FDR (dis) | Study |
|---|---|---|---|---|---|---|---|
| cg05547993 | 16 | 70835035 | VAC14 | 2.72E-9 | -0.013 | 1.95E-6 | DMG:Jaffe_2016 |
eQTL annotation
| SNP ID | Chromosome | Position | eGene | Gene Entrez ID | pvalue | qvalue | TSS distance | eQTL type |
|---|---|---|---|---|---|---|---|---|
| rs4526604 | chr1 | 42182143 | VAC14 | 55697 | 0.02 | trans | ||
| rs710235 | chr1 | 42202713 | VAC14 | 55697 | 0.02 | trans | ||
| rs4284254 | chr1 | 42213075 | VAC14 | 55697 | 0.02 | trans | ||
| rs12495201 | chr3 | 112896372 | VAC14 | 55697 | 0.15 | trans |
Section II. Transcriptome annotation
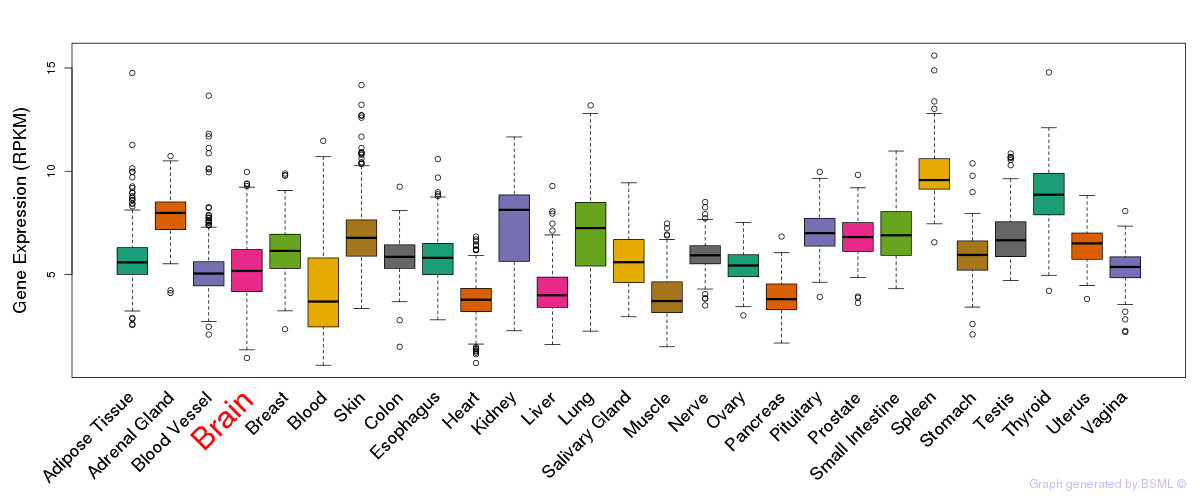
General gene expression (GTEx)
Gene expression during devlopment (BrainCloud)
Footnote:
A total of 269 time points ploted, with n=38 fetal samples (x=1:38). Each triangle represents one time point.
Gene expression of temporal and spatial changes (BrainSpan)
Footnote:
SC: sub-cortical regions; SM: sensory-motor regions; FC: frontal cortex; and TP: temporal-parietal cortex
ST1: fetal (13 - 26 postconception weeks), ST2: early infancy to late childhood (4 months to 11 years), and ST3: adolescence to adulthood (13 - 23 years)
The bar shown representes the lower 25% and upper 25% of the expression distribution.
Top co-expressed genes in brain regions
| Top 10 positively co-expressed genes | ||
| Gene | Pearson's Correlation | Spearman's Correlation |
| PML | 0.93 | 0.89 |
| FSCN1 | 0.90 | 0.88 |
| C17orf62 | 0.89 | 0.90 |
| IRF2BP2 | 0.89 | 0.85 |
| THAP11 | 0.89 | 0.91 |
| C7orf13 | 0.89 | 0.88 |
| ZNF574 | 0.89 | 0.89 |
| VARS | 0.89 | 0.86 |
| FIZ1 | 0.88 | 0.88 |
| RBM14 | 0.88 | 0.91 |
| Top 10 negatively co-expressed genes | ||
| Gene | Pearson's Correlation | Spearman's Correlation |
| AF347015.27 | -0.61 | -0.78 |
| C5orf53 | -0.61 | -0.70 |
| AF347015.31 | -0.60 | -0.75 |
| MT-CO2 | -0.60 | -0.77 |
| AF347015.33 | -0.59 | -0.76 |
| AF347015.8 | -0.59 | -0.78 |
| MT-CYB | -0.57 | -0.75 |
| AF347015.21 | -0.57 | -0.82 |
| COPZ2 | -0.56 | -0.67 |
| S100B | -0.56 | -0.71 |
Section V. Pathway annotation
| Pathway name | Pathway size | # SZGR 2.0 genes in pathway | Info |
|---|---|---|---|
| REACTOME SYNTHESIS OF PIPS AT THE EARLY ENDOSOME MEMBRANE | 12 | 8 | All SZGR 2.0 genes in this pathway |
| REACTOME SYNTHESIS OF PIPS AT THE GOLGI MEMBRANE | 17 | 10 | All SZGR 2.0 genes in this pathway |
| REACTOME PHOSPHOLIPID METABOLISM | 198 | 112 | All SZGR 2.0 genes in this pathway |
| REACTOME SYNTHESIS OF PIPS AT THE LATE ENDOSOME MEMBRANE | 10 | 7 | All SZGR 2.0 genes in this pathway |
| REACTOME PI METABOLISM | 48 | 34 | All SZGR 2.0 genes in this pathway |
| REACTOME METABOLISM OF LIPIDS AND LIPOPROTEINS | 478 | 302 | All SZGR 2.0 genes in this pathway |
| FULCHER INFLAMMATORY RESPONSE LECTIN VS LPS UP | 579 | 346 | All SZGR 2.0 genes in this pathway |
| SENESE HDAC3 TARGETS DN | 536 | 332 | All SZGR 2.0 genes in this pathway |
| BROWNE HCMV INFECTION 16HR UP | 225 | 139 | All SZGR 2.0 genes in this pathway |
| KIM GASTRIC CANCER CHEMOSENSITIVITY | 103 | 64 | All SZGR 2.0 genes in this pathway |
| BONOME OVARIAN CANCER SURVIVAL SUBOPTIMAL DEBULKING | 510 | 309 | All SZGR 2.0 genes in this pathway |
| BRUINS UVC RESPONSE LATE | 1137 | 655 | All SZGR 2.0 genes in this pathway |
| RATTENBACHER BOUND BY CELF1 | 467 | 251 | All SZGR 2.0 genes in this pathway |