Gene Page: TDP1
Summary ?
| GeneID | 55775 |
| Symbol | TDP1 |
| Synonyms | - |
| Description | tyrosyl-DNA phosphodiesterase 1 |
| Reference | MIM:607198|HGNC:HGNC:18884|Ensembl:ENSG00000042088|HPRD:06226|Vega:OTTHUMG00000171016 |
| Gene type | protein-coding |
| Map location | 14q32.11 |
| Pascal p-value | 0.442 |
| Sherlock p-value | 0.444 |
| DMG | 1 (# studies) |
Gene in Data Sources
| Gene set name | Method of gene set | Description | Info |
|---|---|---|---|
| CV:PGCnp | Genome-wide Association Study | GWAS | |
| DMG:Nishioka_2013 | Genome-wide DNA methylation analysis | The authors investigated the methylation profiles of DNA in peripheral blood cells from 18 patients with first-episode schizophrenia (FESZ) and from 15 normal controls. | 1 |
Section I. Genetics and epigenetics annotation
 Differentially methylated gene
| Probe | Chromosome | Position | Nearest gene | P (dis) | Beta (dis) | FDR (dis) | Study |
|---|---|---|---|---|---|---|---|
| cg14454278 | 14 | 90422626 | TDP1 | -0.019 | 0.61 | DMG:Nishioka_2013 |
Section II. Transcriptome annotation
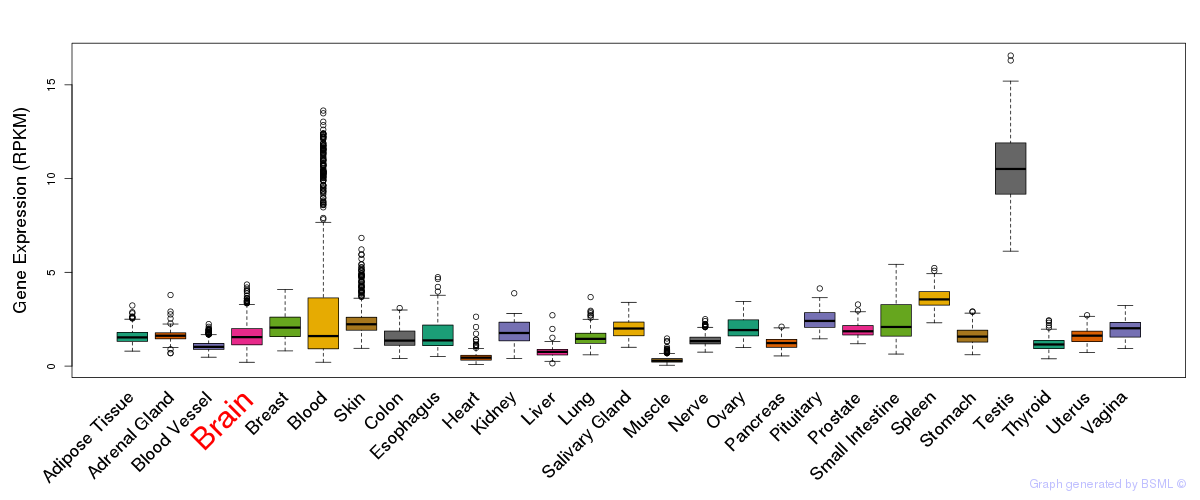
General gene expression (GTEx)
Gene expression of temporal and spatial changes (BrainSpan)
Footnote:
SC: sub-cortical regions; SM: sensory-motor regions; FC: frontal cortex; and TP: temporal-parietal cortex
ST1: fetal (13 - 26 postconception weeks), ST2: early infancy to late childhood (4 months to 11 years), and ST3: adolescence to adulthood (13 - 23 years)
The bar shown representes the lower 25% and upper 25% of the expression distribution.
Top co-expressed genes in brain regions
| Top 10 positively co-expressed genes | ||
| Gene | Pearson's Correlation | Spearman's Correlation |
| ARRDC3 | 0.89 | 0.72 |
| PIBF1 | 0.86 | 0.74 |
| GNAI3 | 0.85 | 0.75 |
| DDX59 | 0.84 | 0.69 |
| INTS8 | 0.84 | 0.73 |
| FAM60A | 0.84 | 0.67 |
| NAP1L1 | 0.84 | 0.68 |
| USP3 | 0.83 | 0.76 |
| ZCCHC7 | 0.83 | 0.71 |
| RBM39 | 0.83 | 0.72 |
| Top 10 negatively co-expressed genes | ||
| Gene | Pearson's Correlation | Spearman's Correlation |
| ASPHD1 | -0.52 | -0.61 |
| TNFSF12 | -0.50 | -0.57 |
| SLC9A3R2 | -0.50 | -0.50 |
| FBXO2 | -0.49 | -0.59 |
| AF347015.27 | -0.49 | -0.67 |
| HLA-F | -0.49 | -0.59 |
| PTH1R | -0.49 | -0.60 |
| SLC16A11 | -0.49 | -0.56 |
| C5orf53 | -0.48 | -0.56 |
| CA4 | -0.48 | -0.64 |
Section V. Pathway annotation
| Pathway name | Pathway size | # SZGR 2.0 genes in pathway | Info |
|---|---|---|---|
| REACTOME DOUBLE STRAND BREAK REPAIR | 24 | 14 | All SZGR 2.0 genes in this pathway |
| REACTOME DNA REPAIR | 112 | 59 | All SZGR 2.0 genes in this pathway |
| GRAESSMANN APOPTOSIS BY DOXORUBICIN DN | 1781 | 1082 | All SZGR 2.0 genes in this pathway |
| GRAESSMANN RESPONSE TO MC AND DOXORUBICIN DN | 770 | 415 | All SZGR 2.0 genes in this pathway |
| WAKASUGI HAVE ZNF143 BINDING SITES | 58 | 33 | All SZGR 2.0 genes in this pathway |
| KAUFFMANN MELANOMA RELAPSE UP | 61 | 25 | All SZGR 2.0 genes in this pathway |
| GEORGES CELL CYCLE MIR192 TARGETS | 62 | 46 | All SZGR 2.0 genes in this pathway |
| GEORGES TARGETS OF MIR192 AND MIR215 | 893 | 528 | All SZGR 2.0 genes in this pathway |
| KAUFFMANN DNA REPAIR GENES | 230 | 137 | All SZGR 2.0 genes in this pathway |
| MARSON BOUND BY E2F4 UNSTIMULATED | 728 | 415 | All SZGR 2.0 genes in this pathway |
| CAIRO HEPATOBLASTOMA CLASSES UP | 605 | 377 | All SZGR 2.0 genes in this pathway |
| DANG REGULATED BY MYC UP | 72 | 53 | All SZGR 2.0 genes in this pathway |
| KASLER HDAC7 TARGETS 1 UP | 194 | 133 | All SZGR 2.0 genes in this pathway |
| ZHOU CELL CYCLE GENES IN IR RESPONSE 24HR | 128 | 73 | All SZGR 2.0 genes in this pathway |