Gene Page: UNC45A
Summary ?
| GeneID | 55898 |
| Symbol | UNC45A |
| Synonyms | GC-UNC45|GCUNC-45|GCUNC45|IRO039700|SMAP-1|SMAP1|UNC-45A |
| Description | unc-45 myosin chaperone A |
| Reference | MIM:611219|HGNC:HGNC:30594|Ensembl:ENSG00000140553|HPRD:18070|Vega:OTTHUMG00000141261 |
| Gene type | protein-coding |
| Map location | 15q26.1 |
| Pascal p-value | 7.22E-5 |
| Sherlock p-value | 0.908 |
| Fetal beta | 0.611 |
| DMG | 1 (# studies) |
| eGene | Myers' cis & trans Meta |
| Support | Ascano FMRP targets |
Gene in Data Sources
| Gene set name | Method of gene set | Description | Info |
|---|---|---|---|
| CV:PGCnp | Genome-wide Association Study | GWAS | |
| DMG:Wockner_2014 | Genome-wide DNA methylation analysis | This dataset includes 4641 differentially methylated probes corresponding to 2929 unique genes between schizophrenia patients (n=24) and controls (n=24). | 1 |
| GO_Annotation | Mapping neuro-related keywords to Gene Ontology annotations | Hits with neuro-related keywords: 1 |
Section I. Genetics and epigenetics annotation
 Differentially methylated gene
| Probe | Chromosome | Position | Nearest gene | P (dis) | Beta (dis) | FDR (dis) | Study |
|---|---|---|---|---|---|---|---|
| cg08939371 | 15 | 91473059 | UNC45A | 2.081E-4 | 0.58 | 0.035 | DMG:Wockner_2014 |
eQTL annotation
| SNP ID | Chromosome | Position | eGene | Gene Entrez ID | pvalue | qvalue | TSS distance | eQTL type |
|---|---|---|---|---|---|---|---|---|
| rs16829545 | chr2 | 151977407 | UNC45A | 55898 | 0.03 | trans | ||
| rs7787830 | chr7 | 98797019 | UNC45A | 55898 | 0.03 | trans | ||
| rs16955618 | chr15 | 29937543 | UNC45A | 55898 | 0.09 | trans |
Section II. Transcriptome annotation
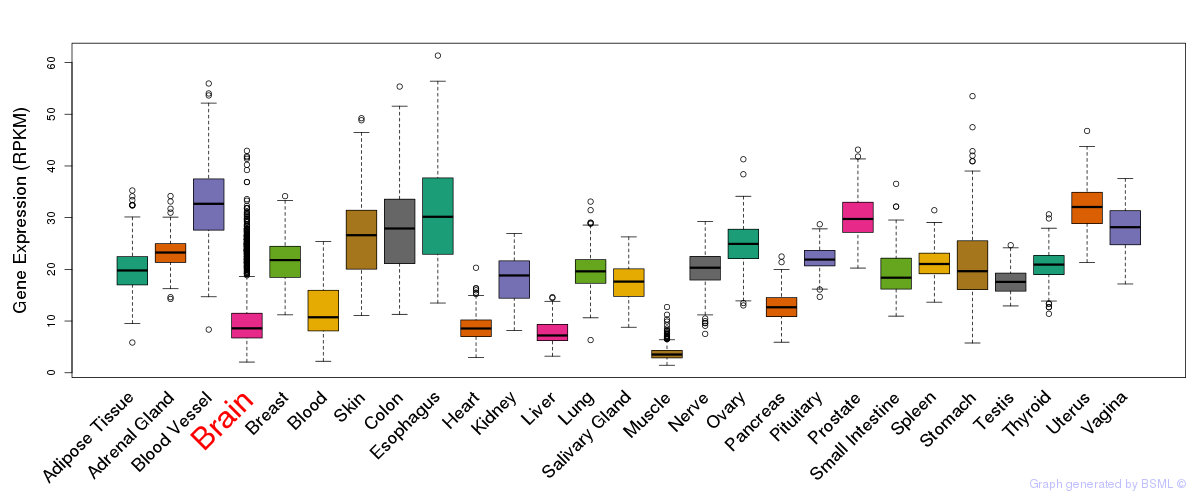
General gene expression (GTEx)
Gene expression during devlopment (BrainCloud)
Footnote:
A total of 269 time points ploted, with n=38 fetal samples (x=1:38). Each triangle represents one time point.
Gene expression of temporal and spatial changes (BrainSpan)
Footnote:
SC: sub-cortical regions; SM: sensory-motor regions; FC: frontal cortex; and TP: temporal-parietal cortex
ST1: fetal (13 - 26 postconception weeks), ST2: early infancy to late childhood (4 months to 11 years), and ST3: adolescence to adulthood (13 - 23 years)
The bar shown representes the lower 25% and upper 25% of the expression distribution.
Top co-expressed genes in brain regions
| Top 10 positively co-expressed genes | ||
| Gene | Pearson's Correlation | Spearman's Correlation |
| NOSIP | 0.90 | 0.88 |
| FAM128A | 0.89 | 0.85 |
| GADD45GIP1 | 0.89 | 0.88 |
| AC174470.1 | 0.89 | 0.85 |
| MRPS24 | 0.88 | 0.85 |
| FAM96B | 0.87 | 0.85 |
| SCAND1 | 0.86 | 0.86 |
| AIP | 0.86 | 0.83 |
| ANAPC11 | 0.85 | 0.85 |
| TCEB2 | 0.85 | 0.81 |
| Top 10 negatively co-expressed genes | ||
| Gene | Pearson's Correlation | Spearman's Correlation |
| FLT1 | -0.49 | -0.54 |
| COBLL1 | -0.49 | -0.51 |
| TJP1 | -0.47 | -0.49 |
| PDE8A | -0.46 | -0.57 |
| ABCA9 | -0.46 | -0.53 |
| EPB41L2 | -0.46 | -0.50 |
| PTPRB | -0.45 | -0.47 |
| PK4P | -0.44 | -0.48 |
| DST | -0.44 | -0.44 |
| ABCB1 | -0.44 | -0.48 |
Section III. Gene Ontology annotation
| Molecular function | GO term | Evidence | Neuro keywords | PubMed ID |
|---|---|---|---|---|
| GO:0005515 | protein binding | IPI | 17353931 | |
| Biological process | GO term | Evidence | Neuro keywords | PubMed ID |
| GO:0007519 | skeletal muscle development | IEA | neuron (GO term level: 8) | - |
| GO:0007275 | multicellular organismal development | IEA | - | |
| GO:0030154 | cell differentiation | IEA | - | |
| Cellular component | GO term | Evidence | Neuro keywords | PubMed ID |
| GO:0005634 | nucleus | IEA | - | |
| GO:0005737 | cytoplasm | IEA | - |
Section V. Pathway annotation
| Pathway name | Pathway size | # SZGR 2.0 genes in pathway | Info |
|---|---|---|---|
| PARENT MTOR SIGNALING UP | 567 | 375 | All SZGR 2.0 genes in this pathway |
| FULCHER INFLAMMATORY RESPONSE LECTIN VS LPS DN | 463 | 290 | All SZGR 2.0 genes in this pathway |
| RODRIGUES THYROID CARCINOMA POORLY DIFFERENTIATED DN | 805 | 505 | All SZGR 2.0 genes in this pathway |
| BARRIER CANCER RELAPSE TUMOR SAMPLE DN | 13 | 6 | All SZGR 2.0 genes in this pathway |
| KUROKAWA LIVER CANCER CHEMOTHERAPY DN | 41 | 28 | All SZGR 2.0 genes in this pathway |
| BURTON ADIPOGENESIS 1 | 33 | 24 | All SZGR 2.0 genes in this pathway |
| LU EZH2 TARGETS UP | 295 | 155 | All SZGR 2.0 genes in this pathway |
| WAKABAYASHI ADIPOGENESIS PPARG BOUND 8D | 658 | 397 | All SZGR 2.0 genes in this pathway |
| LIM MAMMARY STEM CELL UP | 489 | 314 | All SZGR 2.0 genes in this pathway |