Gene Page: BARX1
Summary ?
| GeneID | 56033 |
| Symbol | BARX1 |
| Synonyms | - |
| Description | BARX homeobox 1 |
| Reference | MIM:603260|HGNC:HGNC:955|Ensembl:ENSG00000131668|HPRD:16017|Vega:OTTHUMG00000020255 |
| Gene type | protein-coding |
| Map location | 9q12 |
| Pascal p-value | 7.118E-4 |
| Fetal beta | 0.279 |
| DMG | 1 (# studies) |
| eGene | Meta |
Gene in Data Sources
| Gene set name | Method of gene set | Description | Info |
|---|---|---|---|
| CV:GWASdb | Genome-wide Association Studies | GWASdb records for schizophrenia | |
| CV:PGCnp | Genome-wide Association Study | GWAS | |
| DMG:Jaffe_2016 | Genome-wide DNA methylation analysis | This dataset includes 2,104 probes/CpGs associated with SZ patients (n=108) compared to 136 controls at Bonferroni-adjusted P < 0.05. | 1 |
Section I. Genetics and epigenetics annotation
 Differentially methylated gene
| Probe | Chromosome | Position | Nearest gene | P (dis) | Beta (dis) | FDR (dis) | Study |
|---|---|---|---|---|---|---|---|
| cg14374754 | 9 | 96714295 | BARX1 | 9.99E-10 | -0.013 | 1.17E-6 | DMG:Jaffe_2016 |
Section II. Transcriptome annotation
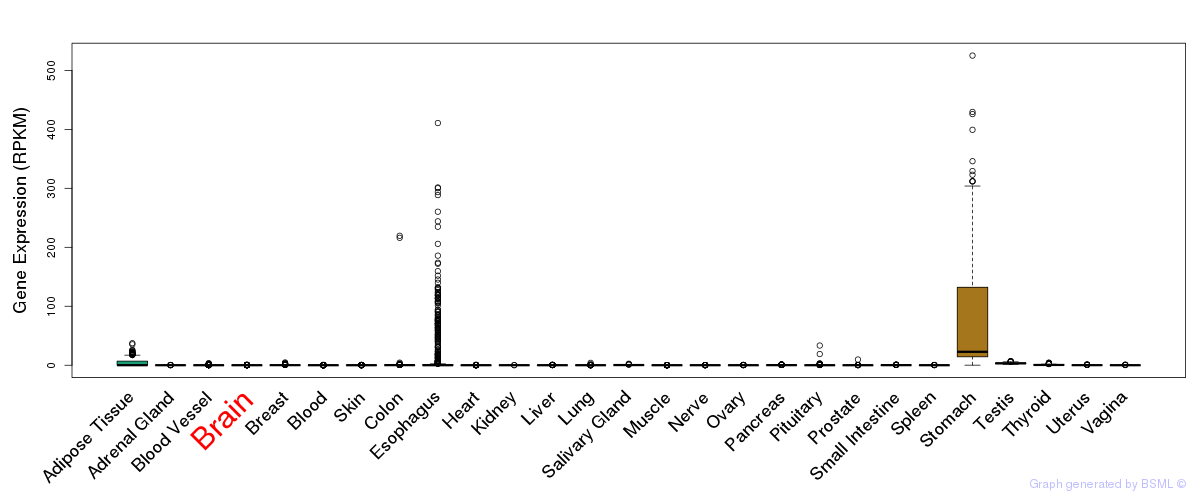
General gene expression (GTEx)
Gene expression during devlopment (BrainCloud)
Footnote:
A total of 269 time points ploted, with n=38 fetal samples (x=1:38). Each triangle represents one time point.
Gene expression of temporal and spatial changes (BrainSpan)
Footnote:
SC: sub-cortical regions; SM: sensory-motor regions; FC: frontal cortex; and TP: temporal-parietal cortex
ST1: fetal (13 - 26 postconception weeks), ST2: early infancy to late childhood (4 months to 11 years), and ST3: adolescence to adulthood (13 - 23 years)
The bar shown representes the lower 25% and upper 25% of the expression distribution.
Top co-expressed genes in brain regions
| Top 10 positively co-expressed genes | ||
| Gene | Pearson's Correlation | Spearman's Correlation |
| AP1G1 | 0.95 | 0.96 |
| TP53BP1 | 0.94 | 0.95 |
| MAP3K7 | 0.94 | 0.95 |
| CPSF6 | 0.94 | 0.95 |
| FBXO38 | 0.94 | 0.95 |
| DCTN4 | 0.94 | 0.95 |
| C4orf41 | 0.94 | 0.95 |
| BCLAF1 | 0.94 | 0.97 |
| WHSC1L1 | 0.94 | 0.96 |
| PDS5A | 0.94 | 0.95 |
| Top 10 negatively co-expressed genes | ||
| Gene | Pearson's Correlation | Spearman's Correlation |
| FXYD1 | -0.80 | -0.86 |
| AF347015.31 | -0.78 | -0.85 |
| MT-CO2 | -0.78 | -0.86 |
| HIGD1B | -0.77 | -0.85 |
| IFI27 | -0.76 | -0.84 |
| AF347015.33 | -0.75 | -0.81 |
| MT-CYB | -0.73 | -0.81 |
| AC021016.1 | -0.73 | -0.78 |
| AF347015.21 | -0.73 | -0.84 |
| AF347015.8 | -0.73 | -0.83 |
Section V. Pathway annotation
| Pathway name | Pathway size | # SZGR 2.0 genes in pathway | Info |
|---|---|---|---|
| HAMAI APOPTOSIS VIA TRAIL DN | 186 | 107 | All SZGR 2.0 genes in this pathway |
| BENPORATH SUZ12 TARGETS | 1038 | 678 | All SZGR 2.0 genes in this pathway |
| BENPORATH EED TARGETS | 1062 | 725 | All SZGR 2.0 genes in this pathway |
| BENPORATH ES WITH H3K27ME3 | 1118 | 744 | All SZGR 2.0 genes in this pathway |
| BENPORATH PRC2 TARGETS | 652 | 441 | All SZGR 2.0 genes in this pathway |
| MORI MATURE B LYMPHOCYTE UP | 90 | 62 | All SZGR 2.0 genes in this pathway |
| KIM GASTRIC CANCER CHEMOSENSITIVITY | 103 | 64 | All SZGR 2.0 genes in this pathway |
| SATO SILENCED BY METHYLATION IN PANCREATIC CANCER 1 | 419 | 273 | All SZGR 2.0 genes in this pathway |
| DOUGLAS BMI1 TARGETS UP | 566 | 371 | All SZGR 2.0 genes in this pathway |
| SMID BREAST CANCER BASAL UP | 648 | 398 | All SZGR 2.0 genes in this pathway |
| MEISSNER BRAIN HCP WITH H3K27ME3 | 269 | 159 | All SZGR 2.0 genes in this pathway |
| MEISSNER NPC HCP WITH H3K4ME2 | 491 | 319 | All SZGR 2.0 genes in this pathway |
| MIKKELSEN MCV6 HCP WITH H3K27ME3 | 435 | 318 | All SZGR 2.0 genes in this pathway |
| MIKKELSEN MEF HCP WITH H3K27ME3 | 590 | 403 | All SZGR 2.0 genes in this pathway |
| YAO TEMPORAL RESPONSE TO PROGESTERONE CLUSTER 4 | 15 | 11 | All SZGR 2.0 genes in this pathway |
| MARTENS TRETINOIN RESPONSE UP | 857 | 456 | All SZGR 2.0 genes in this pathway |