Gene Page: EIF4ENIF1
Summary ?
| GeneID | 56478 |
| Symbol | EIF4ENIF1 |
| Synonyms | 4E-T|Clast4 |
| Description | eukaryotic translation initiation factor 4E nuclear import factor 1 |
| Reference | MIM:607445|HGNC:HGNC:16687|Ensembl:ENSG00000184708|HPRD:10456|Vega:OTTHUMG00000030793 |
| Gene type | protein-coding |
| Map location | 22q11.2 |
| Pascal p-value | 0.088 |
| Sherlock p-value | 0.405 |
| Fetal beta | -0.241 |
| Support | CompositeSet |
Gene in Data Sources
| Gene set name | Method of gene set | Description | Info |
|---|---|---|---|
| CV:PGCnp | Genome-wide Association Study | GWAS | |
| DNM:Fromer_2014 | Whole Exome Sequencing analysis | This study reported a WES study of 623 schizophrenia trios, reporting DNMs using genomic DNA. | |
| PMID:cooccur | High-throughput literature-search | Systematic search in PubMed for genes co-occurring with SCZ keywords. A total of 3027 genes were included. | |
| GSMA_I | Genome scan meta-analysis | Psr: 0.031 | |
| Literature | High-throughput literature-search | Co-occurance with Schizophrenia keywords: schizophrenia,schizophrenias | Click to show details |
| Network | Shortest path distance of core genes in the Human protein-protein interaction network | Contribution to shortest path in PPI network: 0.0033 |
Section I. Genetics and epigenetics annotation
 DNM table
| Gene | Chromosome | Position | Ref | Alt | Transcript | AA change | Mutation type | Sift | CG46 | Trait | Study |
|---|---|---|---|---|---|---|---|---|---|---|---|
| EIF4ENIF1 | chr22 | 31844182 | G | T | NM_001164501 NM_001164502 NM_019843 | p.602P>Q p.427P>Q p.602P>Q | missense missense missense | Schizophrenia | DNM:Fromer_2014 |
Section II. Transcriptome annotation
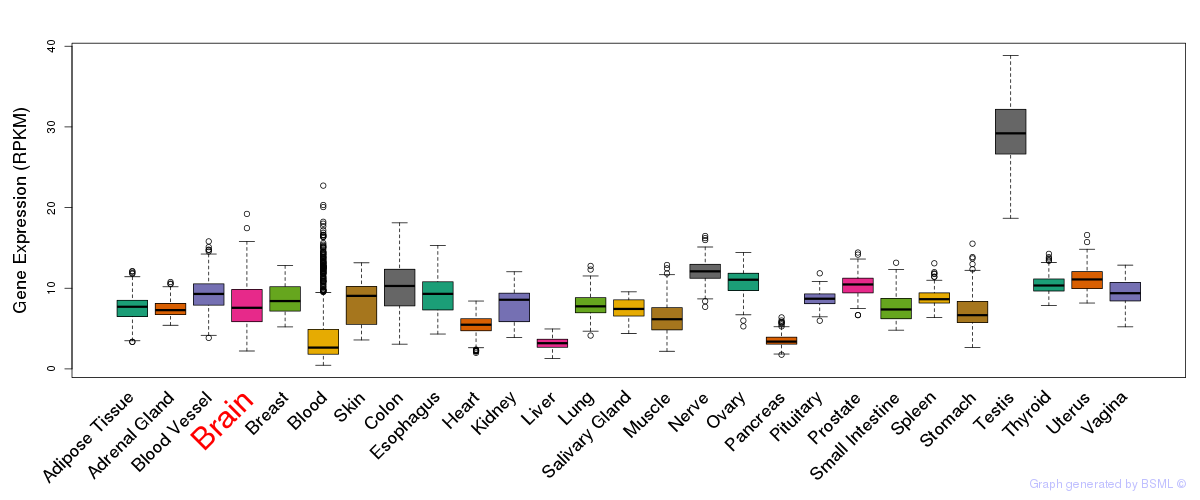
General gene expression (GTEx)
Gene expression during devlopment (BrainCloud)
Footnote:
A total of 269 time points ploted, with n=38 fetal samples (x=1:38). Each triangle represents one time point.
Gene expression of temporal and spatial changes (BrainSpan)
Footnote:
SC: sub-cortical regions; SM: sensory-motor regions; FC: frontal cortex; and TP: temporal-parietal cortex
ST1: fetal (13 - 26 postconception weeks), ST2: early infancy to late childhood (4 months to 11 years), and ST3: adolescence to adulthood (13 - 23 years)
The bar shown representes the lower 25% and upper 25% of the expression distribution.
Top co-expressed genes in brain regions
| Top 10 positively co-expressed genes | ||
| Gene | Pearson's Correlation | Spearman's Correlation |
| ABCB1 | 0.74 | 0.71 |
| GBP3 | 0.73 | 0.68 |
| APOL3 | 0.72 | 0.69 |
| ABCG2 | 0.71 | 0.65 |
| EPAS1 | 0.69 | 0.69 |
| TGFBR2 | 0.69 | 0.63 |
| GBP4 | 0.68 | 0.71 |
| TGM2 | 0.68 | 0.63 |
| APOL1 | 0.67 | 0.66 |
| GPR116 | 0.67 | 0.67 |
| Top 10 negatively co-expressed genes | ||
| Gene | Pearson's Correlation | Spearman's Correlation |
| MED19 | -0.53 | -0.57 |
| ALKBH2 | -0.52 | -0.58 |
| C17orf48 | -0.51 | -0.54 |
| NR2C2AP | -0.51 | -0.54 |
| RPL10A | -0.51 | -0.61 |
| ZNF821 | -0.50 | -0.49 |
| POLB | -0.50 | -0.55 |
| RPL4 | -0.50 | -0.54 |
| RPL5 | -0.50 | -0.60 |
| RBM3 | -0.50 | -0.50 |
Section III. Gene Ontology annotation
| Molecular function | GO term | Evidence | Neuro keywords | PubMed ID |
|---|---|---|---|---|
| GO:0005515 | protein binding | IPI | 10856257 | |
| GO:0008565 | protein transporter activity | TAS | 10856257 | |
| Biological process | GO term | Evidence | Neuro keywords | PubMed ID |
| GO:0015031 | protein transport | IEA | - | |
| Cellular component | GO term | Evidence | Neuro keywords | PubMed ID |
| GO:0005829 | cytosol | IEA | - | |
| GO:0005634 | nucleus | TAS | 10856257 | |
| GO:0005737 | cytoplasm | TAS | 10856257 |
Section V. Pathway annotation
| Pathway name | Pathway size | # SZGR 2.0 genes in pathway | Info |
|---|---|---|---|
| DIAZ CHRONIC MEYLOGENOUS LEUKEMIA UP | 1382 | 904 | All SZGR 2.0 genes in this pathway |
| BENPORATH NANOG TARGETS | 988 | 594 | All SZGR 2.0 genes in this pathway |
| IVANOVA HEMATOPOIESIS STEM CELL LONG TERM | 302 | 191 | All SZGR 2.0 genes in this pathway |
| MARSON BOUND BY FOXP3 STIMULATED | 1022 | 619 | All SZGR 2.0 genes in this pathway |
| ACEVEDO LIVER CANCER UP | 973 | 570 | All SZGR 2.0 genes in this pathway |
| ACEVEDO LIVER TUMOR VS NORMAL ADJACENT TISSUE UP | 863 | 514 | All SZGR 2.0 genes in this pathway |
| PILON KLF1 TARGETS DN | 1972 | 1213 | All SZGR 2.0 genes in this pathway |
| WAKABAYASHI ADIPOGENESIS PPARG RXRA BOUND 8D | 882 | 506 | All SZGR 2.0 genes in this pathway |
Section VI. microRNA annotation
| miRNA family | Target position | miRNA ID | miRNA seq | ||
|---|---|---|---|---|---|
| UTR start | UTR end | Match method | |||
| miR-23 | 252 | 258 | 1A | hsa-miR-23abrain | AUCACAUUGCCAGGGAUUUCC |
| hsa-miR-23bbrain | AUCACAUUGCCAGGGAUUACC | ||||
| miR-377 | 502 | 509 | 1A,m8 | hsa-miR-377 | AUCACACAAAGGCAACUUUUGU |
| miR-493-5p | 327 | 333 | m8 | hsa-miR-493-5p | UUGUACAUGGUAGGCUUUCAUU |
- SZ: miRNAs which differentially expressed in brain cortex of schizophrenia patients comparing with control samples using microarray. Click here to see the list of SZ related miRNAs.
- Brain: miRNAs which are expressed in brain based on miRNA microarray expression studies. Click here to see the list of brain related miRNAs.