Gene Page: PNMAL2
Summary ?
| GeneID | 57469 |
| Symbol | PNMAL2 |
| Synonyms | - |
| Description | paraneoplastic Ma antigen family-like 2 |
| Reference | HGNC:HGNC:29206|Ensembl:ENSG00000204851|Vega:OTTHUMG00000183426 |
| Gene type | protein-coding |
| Map location | 19q13.32 |
| Pascal p-value | 0.256 |
| Sherlock p-value | 0.521 |
| Fetal beta | -2.096 |
| DMG | 1 (# studies) |
Gene in Data Sources
| Gene set name | Method of gene set | Description | Info |
|---|---|---|---|
| DMG:Wockner_2014 | Genome-wide DNA methylation analysis | This dataset includes 4641 differentially methylated probes corresponding to 2929 unique genes between schizophrenia patients (n=24) and controls (n=24). | 1 |
Section I. Genetics and epigenetics annotation
 Differentially methylated gene
| Probe | Chromosome | Position | Nearest gene | P (dis) | Beta (dis) | FDR (dis) | Study |
|---|---|---|---|---|---|---|---|
| cg16167052 | 19 | 46996347 | PNMAL2 | 2.446E-4 | 0.46 | 0.037 | DMG:Wockner_2014 |
Section II. Transcriptome annotation
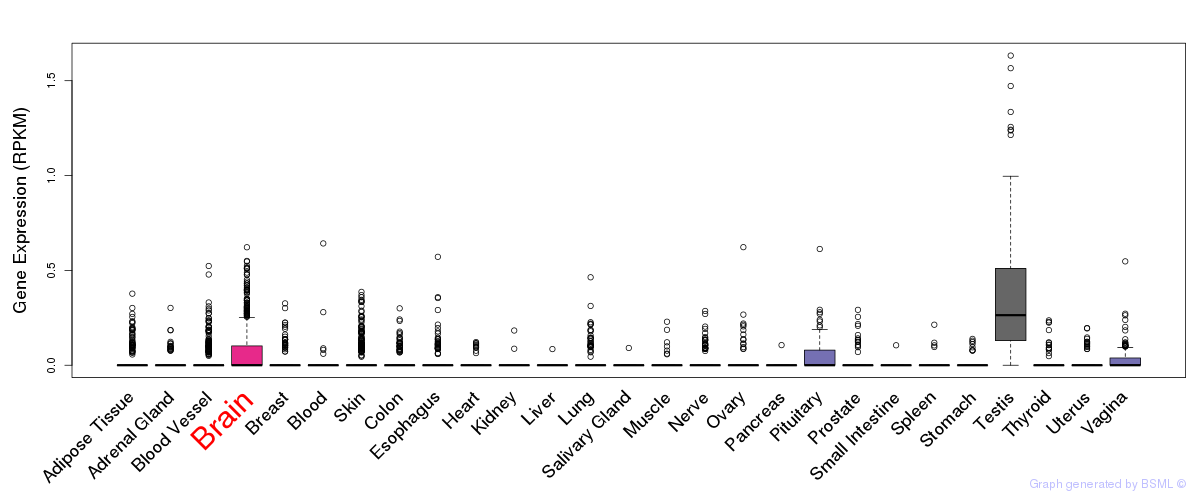
General gene expression (GTEx)
Gene expression during devlopment (BrainCloud)
Footnote:
A total of 269 time points ploted, with n=38 fetal samples (x=1:38). Each triangle represents one time point.
Gene expression of temporal and spatial changes (BrainSpan)
Footnote:
SC: sub-cortical regions; SM: sensory-motor regions; FC: frontal cortex; and TP: temporal-parietal cortex
ST1: fetal (13 - 26 postconception weeks), ST2: early infancy to late childhood (4 months to 11 years), and ST3: adolescence to adulthood (13 - 23 years)
The bar shown representes the lower 25% and upper 25% of the expression distribution.
No co-expressed genes in brain regions
Section V. Pathway annotation
| Pathway name | Pathway size | # SZGR 2.0 genes in pathway | Info |
|---|---|---|---|
| PANGAS TUMOR SUPPRESSION BY SMAD1 AND SMAD5 UP | 134 | 85 | All SZGR 2.0 genes in this pathway |
| LEE BMP2 TARGETS UP | 745 | 475 | All SZGR 2.0 genes in this pathway |