Gene Page: COG6
Summary ?
| GeneID | 57511 |
| Symbol | COG6 |
| Synonyms | CDG2L|COD2|SHNS |
| Description | component of oligomeric golgi complex 6 |
| Reference | MIM:606977|HGNC:HGNC:18621|Ensembl:ENSG00000133103|HPRD:08445|Vega:OTTHUMG00000016768 |
| Gene type | protein-coding |
| Map location | 13q14.11 |
| Pascal p-value | 0.063 |
| Sherlock p-value | 0.523 |
| Fetal beta | -0.548 |
| DMG | 1 (# studies) |
Gene in Data Sources
| Gene set name | Method of gene set | Description | Info |
|---|---|---|---|
| CV:PGCnp | Genome-wide Association Study | GWAS | |
| DMG:Jaffe_2016 | Genome-wide DNA methylation analysis | This dataset includes 2,104 probes/CpGs associated with SZ patients (n=108) compared to 136 controls at Bonferroni-adjusted P < 0.05. | 1 |
Section I. Genetics and epigenetics annotation
 Differentially methylated gene
| Probe | Chromosome | Position | Nearest gene | P (dis) | Beta (dis) | FDR (dis) | Study |
|---|---|---|---|---|---|---|---|
| cg21142158 | 13 | 40229689 | COG6 | 1.29E-8 | -0.018 | 5.18E-6 | DMG:Jaffe_2016 |
Section II. Transcriptome annotation
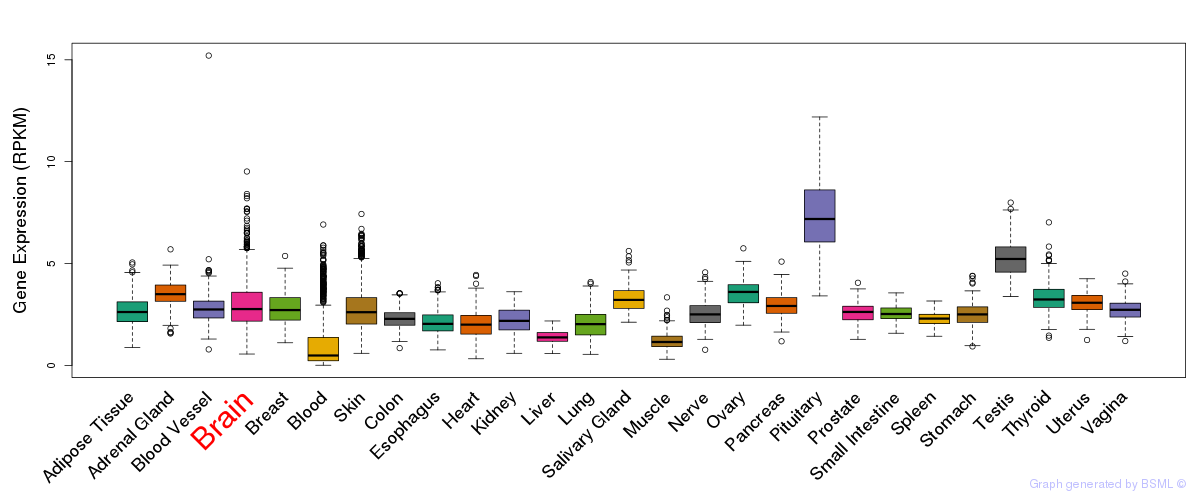
General gene expression (GTEx)
Gene expression during devlopment (BrainCloud)
Footnote:
A total of 269 time points ploted, with n=38 fetal samples (x=1:38). Each triangle represents one time point.
Gene expression of temporal and spatial changes (BrainSpan)
Footnote:
SC: sub-cortical regions; SM: sensory-motor regions; FC: frontal cortex; and TP: temporal-parietal cortex
ST1: fetal (13 - 26 postconception weeks), ST2: early infancy to late childhood (4 months to 11 years), and ST3: adolescence to adulthood (13 - 23 years)
The bar shown representes the lower 25% and upper 25% of the expression distribution.
Top co-expressed genes in brain regions
| Top 10 positively co-expressed genes | ||
| Gene | Pearson's Correlation | Spearman's Correlation |
| RNF145 | 0.92 | 0.95 |
| EIF4G2 | 0.92 | 0.95 |
| MGAT2 | 0.91 | 0.94 |
| TDG | 0.91 | 0.95 |
| PCDHA3 | 0.90 | 0.94 |
| PKIA | 0.90 | 0.94 |
| HSDL1 | 0.89 | 0.94 |
| ZWILCH | 0.89 | 0.94 |
| SQLE | 0.89 | 0.94 |
| PJA1 | 0.89 | 0.94 |
| Top 10 negatively co-expressed genes | ||
| Gene | Pearson's Correlation | Spearman's Correlation |
| HLA-F | -0.74 | -0.80 |
| AIFM3 | -0.74 | -0.79 |
| AF347015.31 | -0.74 | -0.88 |
| AF347015.27 | -0.74 | -0.87 |
| AF347015.33 | -0.73 | -0.88 |
| S100B | -0.73 | -0.84 |
| MT-CO2 | -0.73 | -0.89 |
| TSC22D4 | -0.73 | -0.81 |
| FXYD1 | -0.73 | -0.88 |
| HEPN1 | -0.72 | -0.79 |
Section V. Pathway annotation
| Pathway name | Pathway size | # SZGR 2.0 genes in pathway | Info |
|---|---|---|---|
| WANG LMO4 TARGETS DN | 352 | 225 | All SZGR 2.0 genes in this pathway |
| PETRETTO HEART MASS QTL CIS DN | 24 | 15 | All SZGR 2.0 genes in this pathway |
| CREIGHTON ENDOCRINE THERAPY RESISTANCE 3 | 720 | 440 | All SZGR 2.0 genes in this pathway |
| KYNG DNA DAMAGE BY GAMMA AND UV RADIATION | 88 | 65 | All SZGR 2.0 genes in this pathway |
| KYNG DNA DAMAGE DN | 195 | 135 | All SZGR 2.0 genes in this pathway |
| KYNG NORMAL AGING DN | 30 | 13 | All SZGR 2.0 genes in this pathway |
| KYNG WERNER SYNDROM DN | 29 | 14 | All SZGR 2.0 genes in this pathway |
| DELACROIX RAR BOUND ES | 462 | 273 | All SZGR 2.0 genes in this pathway |
| PECE MAMMARY STEM CELL DN | 146 | 88 | All SZGR 2.0 genes in this pathway |