Gene Page: STARD9
Summary ?
| GeneID | 57519 |
| Symbol | STARD9 |
| Synonyms | KIF16A |
| Description | StAR related lipid transfer domain containing 9 |
| Reference | MIM:614642|HGNC:HGNC:19162|Ensembl:ENSG00000159433|Vega:OTTHUMG00000175799 |
| Gene type | protein-coding |
| Map location | 15q15.2 |
| Pascal p-value | 0.008 |
| Fetal beta | 0.589 |
| DMG | 1 (# studies) |
| eGene | Myers' cis & trans |
Gene in Data Sources
| Gene set name | Method of gene set | Description | Info |
|---|---|---|---|
| CV:PGCnp | Genome-wide Association Study | GWAS | |
| DMG:Wockner_2014 | Genome-wide DNA methylation analysis | This dataset includes 4641 differentially methylated probes corresponding to 2929 unique genes between schizophrenia patients (n=24) and controls (n=24). | 1 |
Section I. Genetics and epigenetics annotation
 Differentially methylated gene
| Probe | Chromosome | Position | Nearest gene | P (dis) | Beta (dis) | FDR (dis) | Study |
|---|---|---|---|---|---|---|---|
| cg24583855 | 15 | 42873727 | STARD9 | 4.447E-4 | 0.737 | 0.045 | DMG:Wockner_2014 |
eQTL annotation
| SNP ID | Chromosome | Position | eGene | Gene Entrez ID | pvalue | qvalue | TSS distance | eQTL type |
|---|---|---|---|---|---|---|---|---|
| rs16829545 | chr2 | 151977407 | STARD9 | 57519 | 0 | trans | ||
| rs16955618 | chr15 | 29937543 | STARD9 | 57519 | 4.589E-4 | trans |
Section II. Transcriptome annotation
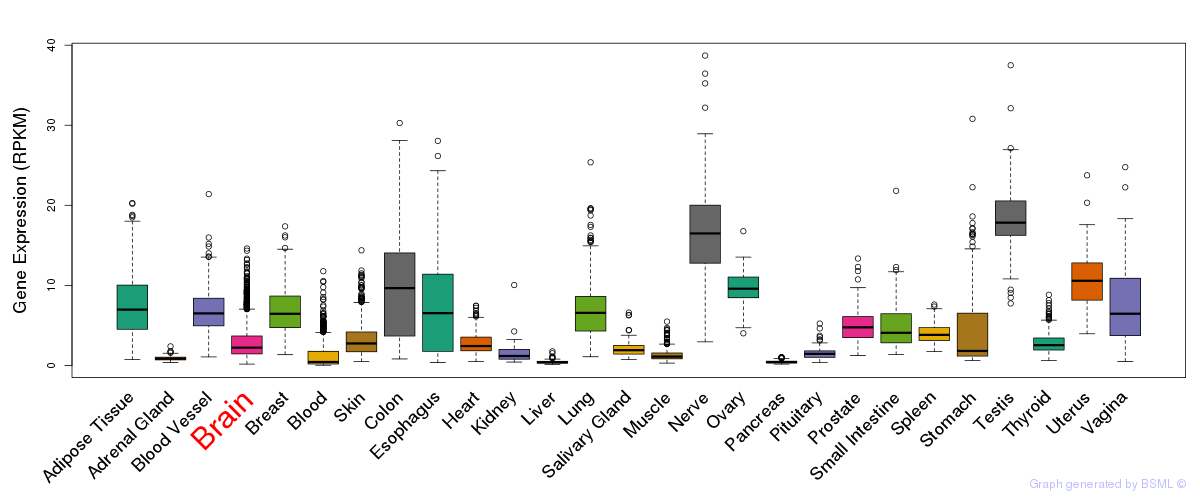
General gene expression (GTEx)
Gene expression during devlopment (BrainCloud)
Footnote:
A total of 269 time points ploted, with n=38 fetal samples (x=1:38). Each triangle represents one time point.
Gene expression of temporal and spatial changes (BrainSpan)
Footnote:
SC: sub-cortical regions; SM: sensory-motor regions; FC: frontal cortex; and TP: temporal-parietal cortex
ST1: fetal (13 - 26 postconception weeks), ST2: early infancy to late childhood (4 months to 11 years), and ST3: adolescence to adulthood (13 - 23 years)
The bar shown representes the lower 25% and upper 25% of the expression distribution.
Top co-expressed genes in brain regions
| Top 10 positively co-expressed genes | ||
| Gene | Pearson's Correlation | Spearman's Correlation |
| ARHGAP18 | 0.76 | 0.72 |
| SLC17A6 | 0.76 | 0.43 |
| CCDC141 | 0.75 | 0.61 |
| KCND2 | 0.74 | 0.60 |
| ANXA2 | 0.73 | 0.37 |
| ANKRD5 | 0.72 | 0.68 |
| DNER | 0.72 | 0.72 |
| SYT9 | 0.72 | 0.27 |
| RGS3 | 0.71 | 0.34 |
| NTNG1 | 0.71 | 0.17 |
| Top 10 negatively co-expressed genes | ||
| Gene | Pearson's Correlation | Spearman's Correlation |
| CXCL14 | -0.38 | -0.58 |
| FXYD1 | -0.35 | -0.58 |
| CA11 | -0.35 | -0.54 |
| COX4I2 | -0.35 | -0.55 |
| GRASP | -0.35 | -0.46 |
| COX7A1 | -0.35 | -0.61 |
| AC138647.1 | -0.34 | -0.47 |
| HSPB3 | -0.34 | -0.48 |
| KRT17 | -0.34 | -0.53 |
| MYL3 | -0.34 | -0.57 |
Section V. Pathway annotation
| Pathway name | Pathway size | # SZGR 2.0 genes in pathway | Info |
|---|---|---|---|
| DODD NASOPHARYNGEAL CARCINOMA UP | 1821 | 933 | All SZGR 2.0 genes in this pathway |
| YOSHIOKA LIVER CANCER EARLY RECURRENCE DN | 65 | 31 | All SZGR 2.0 genes in this pathway |
| ZWANG TRANSIENTLY UP BY 2ND EGF PULSE ONLY | 1725 | 838 | All SZGR 2.0 genes in this pathway |