Gene Page: CASKIN1
Summary ?
| GeneID | 57524 |
| Symbol | CASKIN1 |
| Synonyms | ANKS5A |
| Description | CASK interacting protein 1 |
| Reference | MIM:612184|HGNC:HGNC:20879|Ensembl:ENSG00000167971|HPRD:10809|Vega:OTTHUMG00000177045 |
| Gene type | protein-coding |
| Map location | 16p13.3 |
| Pascal p-value | 0.669 |
| Fetal beta | 1.585 |
| DMG | 1 (# studies) |
| Support | PROTEIN CLUSTERING G2Cdb.human_BAYES-COLLINS-HUMAN-PSD-CONSENSUS G2Cdb.human_BAYES-COLLINS-HUMAN-PSD-FULL G2Cdb.human_BAYES-COLLINS-MOUSE-PSD-CONSENSUS G2Cdb.humanPSD G2Cdb.humanPSP CompositeSet Darnell FMRP targets |
Gene in Data Sources
| Gene set name | Method of gene set | Description | Info |
|---|---|---|---|
| DMG:Wockner_2014 | Genome-wide DNA methylation analysis | This dataset includes 4641 differentially methylated probes corresponding to 2929 unique genes between schizophrenia patients (n=24) and controls (n=24). | 2 |
Section I. Genetics and epigenetics annotation
 Differentially methylated gene
| Probe | Chromosome | Position | Nearest gene | P (dis) | Beta (dis) | FDR (dis) | Study |
|---|---|---|---|---|---|---|---|
| cg06984080 | 16 | 2246994 | CASKIN1 | 1.843E-4 | -0.328 | 0.034 | DMG:Wockner_2014 |
| cg01137955 | 16 | 2228828 | CASKIN1 | 1.959E-4 | -0.304 | 0.035 | DMG:Wockner_2014 |
Section II. Transcriptome annotation
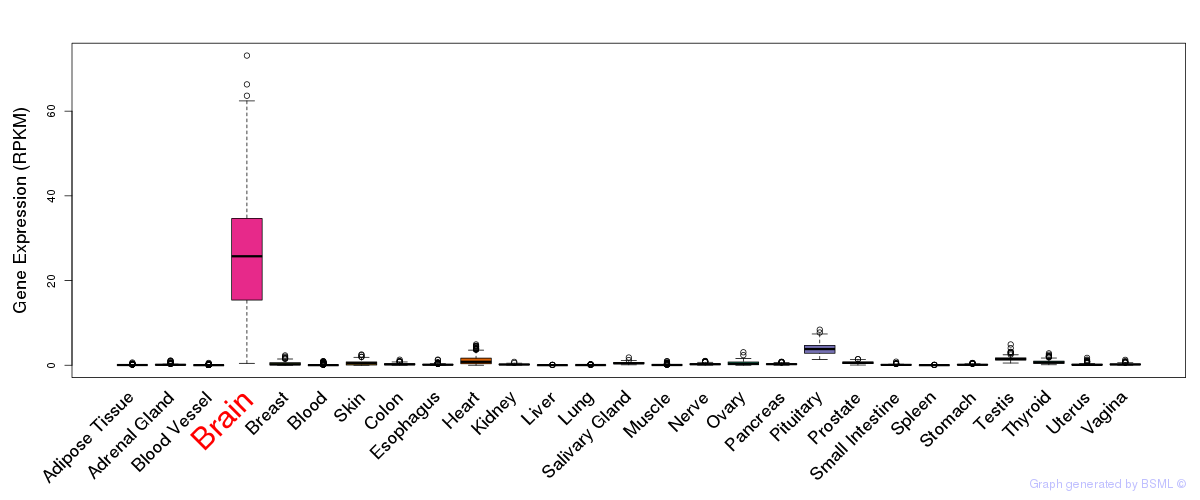
General gene expression (GTEx)
Gene expression during devlopment (BrainCloud)
Footnote:
A total of 269 time points ploted, with n=38 fetal samples (x=1:38). Each triangle represents one time point.
Gene expression of temporal and spatial changes (BrainSpan)
Footnote:
SC: sub-cortical regions; SM: sensory-motor regions; FC: frontal cortex; and TP: temporal-parietal cortex
ST1: fetal (13 - 26 postconception weeks), ST2: early infancy to late childhood (4 months to 11 years), and ST3: adolescence to adulthood (13 - 23 years)
The bar shown representes the lower 25% and upper 25% of the expression distribution.
Top co-expressed genes in brain regions
| Top 10 positively co-expressed genes | ||
| Gene | Pearson's Correlation | Spearman's Correlation |
| FYCO1 | 0.83 | 0.89 |
| ITPKB | 0.79 | 0.82 |
| TLN1 | 0.78 | 0.84 |
| OTUD7B | 0.78 | 0.83 |
| FAM38A | 0.77 | 0.80 |
| RRBP1 | 0.77 | 0.83 |
| ACACB | 0.77 | 0.83 |
| DAAM2 | 0.76 | 0.73 |
| CGNL1 | 0.75 | 0.76 |
| ZCCHC24 | 0.75 | 0.77 |
| Top 10 negatively co-expressed genes | ||
| Gene | Pearson's Correlation | Spearman's Correlation |
| TAF9 | -0.61 | -0.66 |
| VPS29 | -0.59 | -0.65 |
| FAM92A1 | -0.59 | -0.62 |
| NT5C3L | -0.58 | -0.64 |
| TBC1D7 | -0.58 | -0.59 |
| ACTR10 | -0.58 | -0.57 |
| COQ3 | -0.58 | -0.60 |
| C12orf73 | -0.57 | -0.63 |
| ZNF32 | -0.57 | -0.66 |
| POLB | -0.57 | -0.64 |
Section V. Pathway annotation
| Pathway name | Pathway size | # SZGR 2.0 genes in pathway | Info |
|---|---|---|---|
| CAMPS COLON CANCER COPY NUMBER UP | 92 | 45 | All SZGR 2.0 genes in this pathway |
| ZWANG TRANSIENTLY UP BY 2ND EGF PULSE ONLY | 1725 | 838 | All SZGR 2.0 genes in this pathway |