Gene Page: TBC1D14
Summary ?
| GeneID | 57533 |
| Symbol | TBC1D14 |
| Synonyms | - |
| Description | TBC1 domain family member 14 |
| Reference | MIM:614855|HGNC:HGNC:29246|Ensembl:ENSG00000132405|HPRD:11623|Vega:OTTHUMG00000090493 |
| Gene type | protein-coding |
| Map location | 4p16.1 |
| Pascal p-value | 0.083 |
| Sherlock p-value | 0.037 |
| TADA p-value | 0.014 |
| Fetal beta | 1.34 |
| DMG | 1 (# studies) |
| Support | CompositeSet |
Gene in Data Sources
| Gene set name | Method of gene set | Description | Info |
|---|---|---|---|
| CV:PGCnp | Genome-wide Association Study | GWAS | |
| DMG:Wockner_2014 | Genome-wide DNA methylation analysis | This dataset includes 4641 differentially methylated probes corresponding to 2929 unique genes between schizophrenia patients (n=24) and controls (n=24). | 1 |
| DNM:Xu_2012 | Whole Exome Sequencing analysis | De novo mutations of 4 genes were identified by exome sequencing of 795 samples in this study |
Section I. Genetics and epigenetics annotation
 DNM table
| Gene | Chromosome | Position | Ref | Alt | Transcript | AA change | Mutation type | Sift | CG46 | Trait | Study |
|---|---|---|---|---|---|---|---|---|---|---|---|
| TBC1D14 | chr4 | 7008404 | T | C | NM_001113361 NM_001113363 NM_020773 | p.466I>T p.186I>T p.466I>T | missense missense missense | Schizophrenia | DNM:Xu_2012 |
Differentially methylated gene
| Probe | Chromosome | Position | Nearest gene | P (dis) | Beta (dis) | FDR (dis) | Study |
|---|---|---|---|---|---|---|---|
| ch.4.255198F | 4 | 7007709 | TBC1D14 | 1.75E-5 | -0.641 | 0.016 | DMG:Wockner_2014 |
Section II. Transcriptome annotation
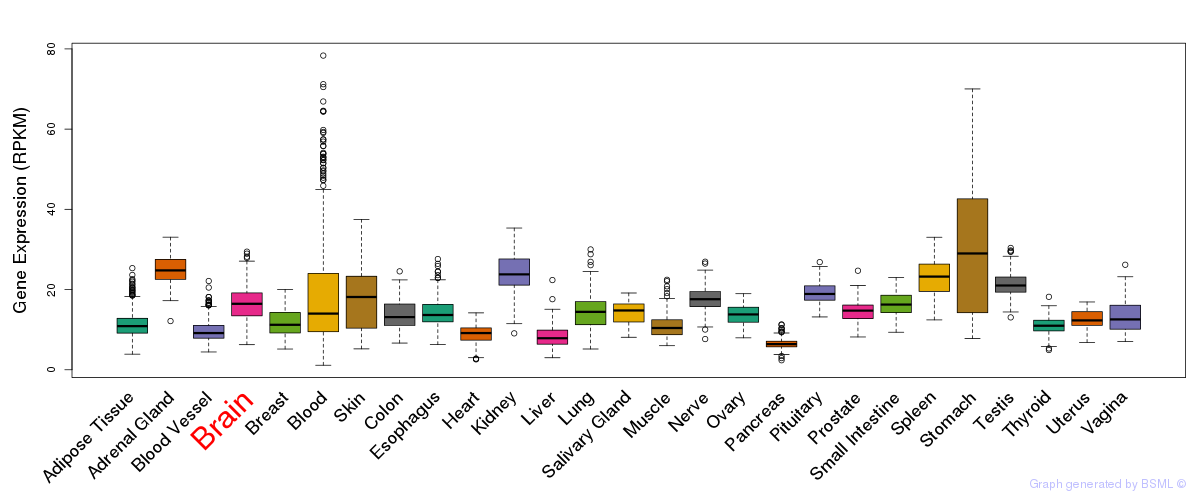
General gene expression (GTEx)
Gene expression during devlopment (BrainCloud)
Footnote:
A total of 269 time points ploted, with n=38 fetal samples (x=1:38). Each triangle represents one time point.
Gene expression of temporal and spatial changes (BrainSpan)
Footnote:
SC: sub-cortical regions; SM: sensory-motor regions; FC: frontal cortex; and TP: temporal-parietal cortex
ST1: fetal (13 - 26 postconception weeks), ST2: early infancy to late childhood (4 months to 11 years), and ST3: adolescence to adulthood (13 - 23 years)
The bar shown representes the lower 25% and upper 25% of the expression distribution.
Top co-expressed genes in brain regions
| Top 10 positively co-expressed genes | ||
| Gene | Pearson's Correlation | Spearman's Correlation |
| PDZD11 | 0.88 | 0.84 |
| SUCLG1 | 0.87 | 0.85 |
| ATP5C1 | 0.87 | 0.83 |
| AMZ2 | 0.87 | 0.79 |
| WDR61 | 0.86 | 0.82 |
| HAX1 | 0.85 | 0.86 |
| ATP5F1 | 0.84 | 0.85 |
| MRPS33 | 0.84 | 0.76 |
| STOML2 | 0.84 | 0.80 |
| C1orf43 | 0.84 | 0.78 |
| Top 10 negatively co-expressed genes | ||
| Gene | Pearson's Correlation | Spearman's Correlation |
| AF347015.18 | -0.48 | -0.48 |
| AC010300.1 | -0.46 | -0.59 |
| AC016705.1 | -0.45 | -0.49 |
| C10orf108 | -0.45 | -0.53 |
| PPP1R13L | -0.44 | -0.40 |
| MYH9 | -0.44 | -0.38 |
| AF347015.26 | -0.43 | -0.44 |
| RRBP1 | -0.42 | -0.43 |
| AC073957.1 | -0.42 | -0.46 |
| DOCK6 | -0.42 | -0.42 |
Section V. Pathway annotation
| Pathway name | Pathway size | # SZGR 2.0 genes in pathway | Info |
|---|---|---|---|
| LASTOWSKA NEUROBLASTOMA COPY NUMBER DN | 800 | 473 | All SZGR 2.0 genes in this pathway |
| PEREZ TP53 TARGETS | 1174 | 695 | All SZGR 2.0 genes in this pathway |
| PATIL LIVER CANCER | 747 | 453 | All SZGR 2.0 genes in this pathway |
| MORI MATURE B LYMPHOCYTE UP | 90 | 62 | All SZGR 2.0 genes in this pathway |
| ACEVEDO NORMAL TISSUE ADJACENT TO LIVER TUMOR DN | 354 | 216 | All SZGR 2.0 genes in this pathway |
| GOBERT OLIGODENDROCYTE DIFFERENTIATION DN | 1080 | 713 | All SZGR 2.0 genes in this pathway |