Gene Page: USP36
Summary ?
| GeneID | 57602 |
| Symbol | USP36 |
| Synonyms | DUB1 |
| Description | ubiquitin specific peptidase 36 |
| Reference | MIM:612543|HGNC:HGNC:20062|Ensembl:ENSG00000055483|HPRD:07164|Vega:OTTHUMG00000177542 |
| Gene type | protein-coding |
| Map location | 17q25.3 |
| Pascal p-value | 0.004 |
| Sherlock p-value | 0.911 |
| DMG | 1 (# studies) |
| eGene | Caudate basal ganglia Cerebellar Hemisphere Cerebellum Cortex Hippocampus Nucleus accumbens basal ganglia Putamen basal ganglia Myers' cis & trans Meta |
Gene in Data Sources
| Gene set name | Method of gene set | Description | Info |
|---|---|---|---|
| CV:GWASdb | Genome-wide Association Studies | GWASdb records for schizophrenia | |
| CV:PGCnp | Genome-wide Association Study | GWAS | |
| DMG:Wockner_2014 | Genome-wide DNA methylation analysis | This dataset includes 4641 differentially methylated probes corresponding to 2929 unique genes between schizophrenia patients (n=24) and controls (n=24). | 1 |
| Expression | Meta-analysis of gene expression | P value: 2.033 |
Section I. Genetics and epigenetics annotation
 Differentially methylated gene
| Probe | Chromosome | Position | Nearest gene | P (dis) | Beta (dis) | FDR (dis) | Study |
|---|---|---|---|---|---|---|---|
| cg27021056 | 17 | 76837047 | USP36 | 2.451E-4 | -0.224 | 0.037 | DMG:Wockner_2014 |
eQTL annotation
| SNP ID | Chromosome | Position | eGene | Gene Entrez ID | pvalue | qvalue | TSS distance | eQTL type |
|---|---|---|---|---|---|---|---|---|
| rs10512617 | chr17 | 76693550 | USP36 | 57602 | 1.207E-7 | cis | ||
| rs17736494 | chr17 | 76728667 | USP36 | 57602 | 3.699E-8 | cis | ||
| rs1384367 | chr17 | 76729756 | USP36 | 57602 | 7.953E-8 | cis | ||
| rs8182269 | chr17 | 76789990 | USP36 | 57602 | 3.186E-6 | cis | ||
| rs10512617 | chr17 | 76693550 | USP36 | 57602 | 2.646E-5 | trans | ||
| rs17736494 | chr17 | 76728667 | USP36 | 57602 | 8.54E-6 | trans | ||
| rs1384367 | chr17 | 76729756 | USP36 | 57602 | 1.758E-5 | trans | ||
| rs8182269 | chr17 | 76789990 | USP36 | 57602 | 5.581E-4 | trans | ||
| rs3744802 | 17 | 76793600 | USP36 | ENSG00000055483.15 | 9.501E-7 | 0.02 | 43923 | gtex_brain_putamen_basal |
| rs3826552 | 17 | 76793885 | USP36 | ENSG00000055483.15 | 9.134E-7 | 0.02 | 43638 | gtex_brain_putamen_basal |
| rs2306526 | 17 | 76798362 | USP36 | ENSG00000055483.15 | 4.587E-7 | 0.02 | 39161 | gtex_brain_putamen_basal |
| rs3088040 | 17 | 76799860 | USP36 | ENSG00000055483.15 | 1.811E-6 | 0.02 | 37663 | gtex_brain_putamen_basal |
| rs9302885 | 17 | 76799898 | USP36 | ENSG00000055483.15 | 1.584E-6 | 0.02 | 37625 | gtex_brain_putamen_basal |
| rs11649964 | 17 | 76800182 | USP36 | ENSG00000055483.15 | 7.396E-7 | 0.02 | 37341 | gtex_brain_putamen_basal |
| rs6501250 | 17 | 76808726 | USP36 | ENSG00000055483.15 | 4.688E-7 | 0.02 | 28797 | gtex_brain_putamen_basal |
| rs7220532 | 17 | 76808773 | USP36 | ENSG00000055483.15 | 4.682E-7 | 0.02 | 28750 | gtex_brain_putamen_basal |
| rs202089733 | 17 | 76809351 | USP36 | ENSG00000055483.15 | 1.151E-6 | 0.02 | 28172 | gtex_brain_putamen_basal |
| rs1110274 | 17 | 76810284 | USP36 | ENSG00000055483.15 | 5.204E-7 | 0.02 | 27239 | gtex_brain_putamen_basal |
| rs7218605 | 17 | 76811803 | USP36 | ENSG00000055483.15 | 5.481E-7 | 0.02 | 25720 | gtex_brain_putamen_basal |
| rs2376828 | 17 | 76812840 | USP36 | ENSG00000055483.15 | 1.797E-6 | 0.02 | 24683 | gtex_brain_putamen_basal |
| rs11650000 | 17 | 76828154 | USP36 | ENSG00000055483.15 | 1.475E-6 | 0.02 | 9369 | gtex_brain_putamen_basal |
| rs4352096 | 17 | 76833916 | USP36 | ENSG00000055483.15 | 1.024E-6 | 0.02 | 3607 | gtex_brain_putamen_basal |
Section II. Transcriptome annotation
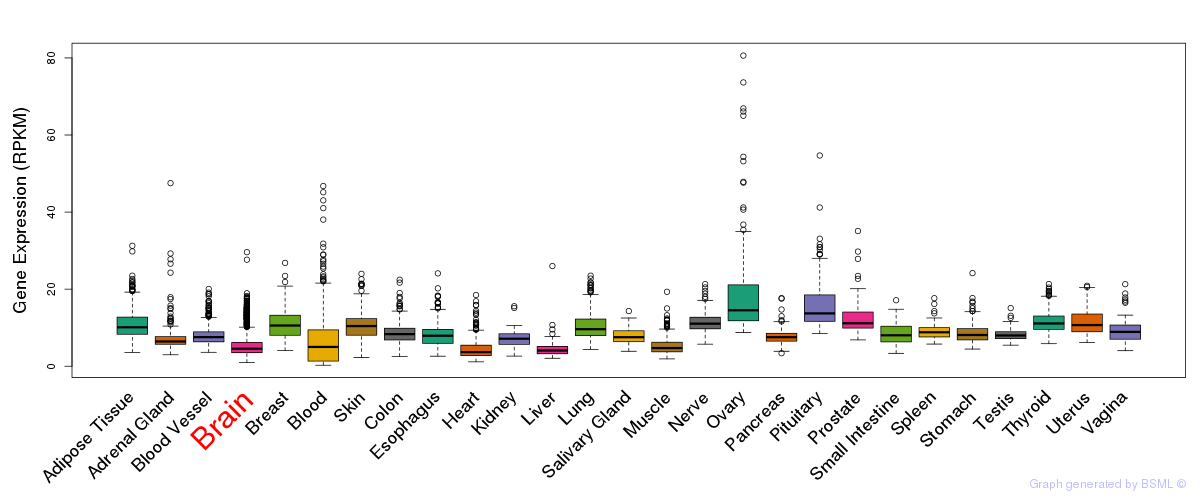
General gene expression (GTEx)
Gene expression of temporal and spatial changes (BrainSpan)
Footnote:
SC: sub-cortical regions; SM: sensory-motor regions; FC: frontal cortex; and TP: temporal-parietal cortex
ST1: fetal (13 - 26 postconception weeks), ST2: early infancy to late childhood (4 months to 11 years), and ST3: adolescence to adulthood (13 - 23 years)
The bar shown representes the lower 25% and upper 25% of the expression distribution.
Top co-expressed genes in brain regions
| Top 10 positively co-expressed genes | ||
| Gene | Pearson's Correlation | Spearman's Correlation |
| NDC80 | 0.99 | 0.76 |
| SGOL1 | 0.98 | 0.75 |
| TTK | 0.98 | 0.75 |
| MELK | 0.98 | 0.75 |
| HMGB2 | 0.98 | 0.59 |
| EXO1 | 0.98 | 0.71 |
| DLGAP5 | 0.97 | 0.79 |
| KIF23 | 0.97 | 0.73 |
| PBK | 0.97 | 0.75 |
| CCNB2 | 0.97 | 0.77 |
| Top 10 negatively co-expressed genes | ||
| Gene | Pearson's Correlation | Spearman's Correlation |
| SLC9A3R2 | -0.38 | -0.55 |
| FBXO2 | -0.36 | -0.64 |
| ASPHD1 | -0.36 | -0.61 |
| PTH1R | -0.36 | -0.63 |
| HLA-F | -0.36 | -0.65 |
| TNFSF12 | -0.35 | -0.62 |
| C5orf53 | -0.35 | -0.62 |
| ADAP1 | -0.34 | -0.41 |
| LHPP | -0.34 | -0.58 |
| CA4 | -0.34 | -0.67 |
Section III. Gene Ontology annotation
| Molecular function | GO term | Evidence | Neuro keywords | PubMed ID |
|---|---|---|---|---|
| GO:0004221 | ubiquitin thiolesterase activity | IEA | - | |
| GO:0008234 | cysteine-type peptidase activity | IEA | - | |
| GO:0008233 | peptidase activity | IEA | - | |
| Biological process | GO term | Evidence | Neuro keywords | PubMed ID |
| GO:0006511 | ubiquitin-dependent protein catabolic process | IEA | - | |
| Cellular component | GO term | Evidence | Neuro keywords | PubMed ID |
| GO:0005634 | nucleus | IEA | - |
Section V. Pathway annotation
| Pathway name | Pathway size | # SZGR 2.0 genes in pathway | Info |
|---|---|---|---|
| WANG LMO4 TARGETS UP | 372 | 227 | All SZGR 2.0 genes in this pathway |
| OSMAN BLADDER CANCER DN | 406 | 230 | All SZGR 2.0 genes in this pathway |
| RHEIN ALL GLUCOCORTICOID THERAPY UP | 78 | 41 | All SZGR 2.0 genes in this pathway |
| UDAYAKUMAR MED1 TARGETS DN | 240 | 171 | All SZGR 2.0 genes in this pathway |
| NAGASHIMA NRG1 SIGNALING UP | 176 | 123 | All SZGR 2.0 genes in this pathway |
| COLDREN GEFITINIB RESISTANCE UP | 85 | 57 | All SZGR 2.0 genes in this pathway |
| GRAESSMANN APOPTOSIS BY DOXORUBICIN DN | 1781 | 1082 | All SZGR 2.0 genes in this pathway |
| GRAESSMANN RESPONSE TO MC AND DOXORUBICIN DN | 770 | 415 | All SZGR 2.0 genes in this pathway |
| NUYTTEN NIPP1 TARGETS UP | 769 | 437 | All SZGR 2.0 genes in this pathway |
| NUYTTEN EZH2 TARGETS DN | 1024 | 594 | All SZGR 2.0 genes in this pathway |
| BUYTAERT PHOTODYNAMIC THERAPY STRESS UP | 811 | 508 | All SZGR 2.0 genes in this pathway |
| NIKOLSKY BREAST CANCER 17Q21 Q25 AMPLICON | 335 | 181 | All SZGR 2.0 genes in this pathway |
| SHEPARD BMYB MORPHOLINO UP | 205 | 126 | All SZGR 2.0 genes in this pathway |
| MITSIADES RESPONSE TO APLIDIN UP | 439 | 257 | All SZGR 2.0 genes in this pathway |
| BOQUEST STEM CELL DN | 216 | 143 | All SZGR 2.0 genes in this pathway |
| BEIER GLIOMA STEM CELL DN | 66 | 42 | All SZGR 2.0 genes in this pathway |
| KRIEG HYPOXIA NOT VIA KDM3A | 770 | 480 | All SZGR 2.0 genes in this pathway |
| ZWANG TRANSIENTLY UP BY 1ST EGF PULSE ONLY | 1839 | 928 | All SZGR 2.0 genes in this pathway |