Gene Page: KIAA1456
Summary ?
| GeneID | 57604 |
| Symbol | KIAA1456 |
| Synonyms | C8orf79|TRM9L |
| Description | KIAA1456 |
| Reference | MIM:615666|HGNC:HGNC:26725|Ensembl:ENSG00000250305|HPRD:13862|Vega:OTTHUMG00000165477 |
| Gene type | protein-coding |
| Map location | 8p22 |
| Pascal p-value | 2.06E-4 |
| Fetal beta | 1.857 |
| DMG | 1 (# studies) |
Gene in Data Sources
| Gene set name | Method of gene set | Description | Info |
|---|---|---|---|
| CV:GWASdb | Genome-wide Association Studies | GWASdb records for schizophrenia | |
| CV:PGCnp | Genome-wide Association Study | GWAS | |
| DMG:Jaffe_2016 | Genome-wide DNA methylation analysis | This dataset includes 2,104 probes/CpGs associated with SZ patients (n=108) compared to 136 controls at Bonferroni-adjusted P < 0.05. | 1 |
Section I. Genetics and epigenetics annotation
 Differentially methylated gene
| Probe | Chromosome | Position | Nearest gene | P (dis) | Beta (dis) | FDR (dis) | Study |
|---|---|---|---|---|---|---|---|
| cg14501253 | 8 | 12809014 | KIAA1456 | 5.03E-8 | -0.014 | 1.34E-5 | DMG:Jaffe_2016 |
Section II. Transcriptome annotation
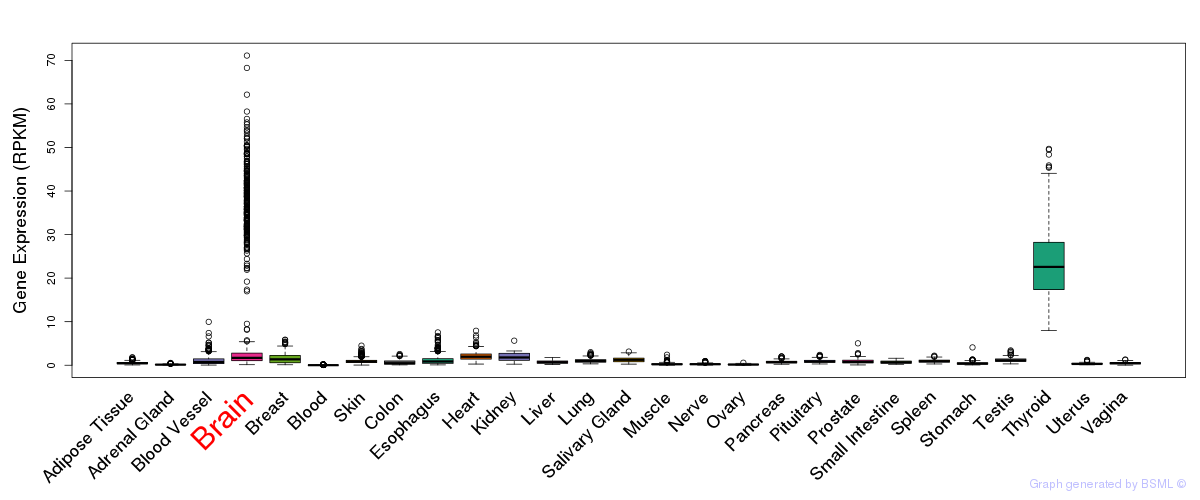
General gene expression (GTEx)
Gene expression during devlopment (BrainCloud)
Footnote:
A total of 269 time points ploted, with n=38 fetal samples (x=1:38). Each triangle represents one time point.
Gene expression of temporal and spatial changes (BrainSpan)
Footnote:
SC: sub-cortical regions; SM: sensory-motor regions; FC: frontal cortex; and TP: temporal-parietal cortex
ST1: fetal (13 - 26 postconception weeks), ST2: early infancy to late childhood (4 months to 11 years), and ST3: adolescence to adulthood (13 - 23 years)
The bar shown representes the lower 25% and upper 25% of the expression distribution.
Top co-expressed genes in brain regions
| Top 10 positively co-expressed genes | ||
| Gene | Pearson's Correlation | Spearman's Correlation |
| AUP1 | 0.83 | 0.78 |
| MRPL38 | 0.83 | 0.82 |
| TUSC4 | 0.82 | 0.79 |
| YIPF2 | 0.82 | 0.80 |
| COPE | 0.82 | 0.81 |
| C16orf84 | 0.81 | 0.76 |
| WDR45 | 0.81 | 0.79 |
| NDUFS8 | 0.81 | 0.79 |
| MRPL4 | 0.81 | 0.79 |
| TMEM147 | 0.81 | 0.79 |
| Top 10 negatively co-expressed genes | ||
| Gene | Pearson's Correlation | Spearman's Correlation |
| MT-ATP8 | -0.50 | -0.52 |
| AF347015.18 | -0.48 | -0.51 |
| AF347015.8 | -0.47 | -0.45 |
| AL139819.3 | -0.45 | -0.46 |
| AF347015.2 | -0.45 | -0.43 |
| AF347015.26 | -0.44 | -0.45 |
| AF347015.15 | -0.43 | -0.42 |
| MT-CYB | -0.43 | -0.44 |
| AF347015.27 | -0.42 | -0.43 |
| SEC62 | -0.41 | -0.50 |
Section V. Pathway annotation
| Pathway name | Pathway size | # SZGR 2.0 genes in pathway | Info |
|---|---|---|---|
| SCHAEFFER PROSTATE DEVELOPMENT 48HR UP | 487 | 286 | All SZGR 2.0 genes in this pathway |
| SCHAEFFER SOX9 TARGETS IN PROSTATE DEVELOPMENT UP | 21 | 19 | All SZGR 2.0 genes in this pathway |
| SANSOM APC TARGETS | 212 | 121 | All SZGR 2.0 genes in this pathway |
| SANSOM APC TARGETS REQUIRE MYC | 210 | 123 | All SZGR 2.0 genes in this pathway |
| RIGGI EWING SARCOMA PROGENITOR UP | 430 | 288 | All SZGR 2.0 genes in this pathway |
| CHEN METABOLIC SYNDROM NETWORK | 1210 | 725 | All SZGR 2.0 genes in this pathway |
| PEDRIOLI MIR31 TARGETS DN | 418 | 245 | All SZGR 2.0 genes in this pathway |