Gene Page: NCOA5
Summary ?
| GeneID | 57727 |
| Symbol | NCOA5 |
| Synonyms | CIA|bA465L10.6 |
| Description | nuclear receptor coactivator 5 |
| Reference | MIM:616825|HGNC:HGNC:15909|Ensembl:ENSG00000124160|HPRD:14813|Vega:OTTHUMG00000032639 |
| Gene type | protein-coding |
| Map location | 20q13.12 |
| Pascal p-value | 0.015 |
| Fetal beta | 0.986 |
| DMG | 2 (# studies) |
Gene in Data Sources
| Gene set name | Method of gene set | Description | Info |
|---|---|---|---|
| CV:GWASdb | Genome-wide Association Studies | GWASdb records for schizophrenia | |
| CV:PGCnp | Genome-wide Association Study | GWAS | |
| DMG:Nishioka_2013 | Genome-wide DNA methylation analysis | The authors investigated the methylation profiles of DNA in peripheral blood cells from 18 patients with first-episode schizophrenia (FESZ) and from 15 normal controls. | 2 |
| DMG:vanEijk_2014 | Genome-wide DNA methylation analysis | This dataset includes 432 differentially methylated CpG sites corresponding to 391 unique transcripts between schizophrenia patients (n=260) and unaffected controls (n=250). | 2 |
Section I. Genetics and epigenetics annotation
 Differentially methylated gene
| Probe | Chromosome | Position | Nearest gene | P (dis) | Beta (dis) | FDR (dis) | Study |
|---|---|---|---|---|---|---|---|
| cg20116574 | 20 | 44718168 | NCOA5 | -0.026 | 0.77 | DMG:Nishioka_2013 | |
| cg00576250 | 20 | 45087765 | NCOA5 | 0.003 | 2.492 | DMG:vanEijk_2014 |
Section II. Transcriptome annotation
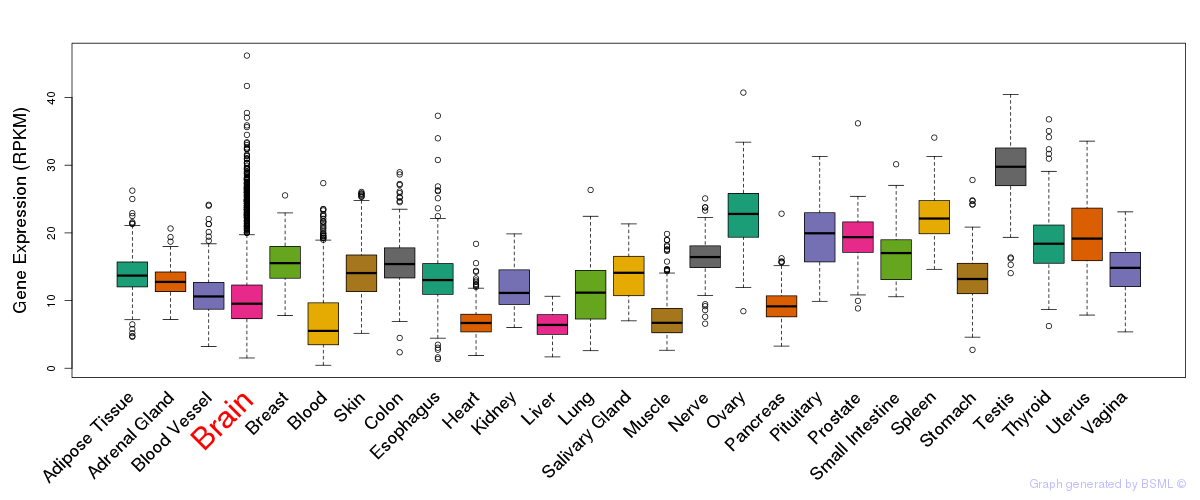
General gene expression (GTEx)
Gene expression during devlopment (BrainCloud)
Footnote:
A total of 269 time points ploted, with n=38 fetal samples (x=1:38). Each triangle represents one time point.
Gene expression of temporal and spatial changes (BrainSpan)
Footnote:
SC: sub-cortical regions; SM: sensory-motor regions; FC: frontal cortex; and TP: temporal-parietal cortex
ST1: fetal (13 - 26 postconception weeks), ST2: early infancy to late childhood (4 months to 11 years), and ST3: adolescence to adulthood (13 - 23 years)
The bar shown representes the lower 25% and upper 25% of the expression distribution.
Top co-expressed genes in brain regions
| Top 10 positively co-expressed genes | ||
| Gene | Pearson's Correlation | Spearman's Correlation |
| CD68 | 0.77 | 0.70 |
| DOCK2 | 0.71 | 0.63 |
| SIGLEC10 | 0.71 | 0.60 |
| NCKAP1L | 0.70 | 0.61 |
| CD300A | 0.70 | 0.71 |
| SYK | 0.69 | 0.63 |
| SLC37A2 | 0.69 | 0.54 |
| CX3CR1 | 0.69 | 0.74 |
| C2 | 0.68 | 0.74 |
| ITGB2 | 0.67 | 0.60 |
| Top 10 negatively co-expressed genes | ||
| Gene | Pearson's Correlation | Spearman's Correlation |
| MT-CO2 | -0.48 | -0.67 |
| AF347015.31 | -0.47 | -0.65 |
| FXYD1 | -0.47 | -0.62 |
| C5orf53 | -0.46 | -0.58 |
| AF347015.33 | -0.45 | -0.61 |
| MT-CYB | -0.44 | -0.62 |
| CA4 | -0.43 | -0.53 |
| AF347015.8 | -0.43 | -0.63 |
| AF347015.9 | -0.43 | -0.61 |
| AF347015.27 | -0.43 | -0.62 |
Section V. Pathway annotation
| Pathway name | Pathway size | # SZGR 2.0 genes in pathway | Info |
|---|---|---|---|
| RICKMAN TUMOR DIFFERENTIATED WELL VS POORLY UP | 236 | 139 | All SZGR 2.0 genes in this pathway |
| BENPORATH CYCLING GENES | 648 | 385 | All SZGR 2.0 genes in this pathway |
| DOUGLAS BMI1 TARGETS UP | 566 | 371 | All SZGR 2.0 genes in this pathway |
| MARTINEZ RB1 TARGETS DN | 543 | 317 | All SZGR 2.0 genes in this pathway |
| MARTINEZ TP53 TARGETS UP | 602 | 364 | All SZGR 2.0 genes in this pathway |
| MARTINEZ RB1 AND TP53 TARGETS DN | 591 | 366 | All SZGR 2.0 genes in this pathway |
| WHITFIELD CELL CYCLE G2 | 182 | 102 | All SZGR 2.0 genes in this pathway |
| WHITFIELD CELL CYCLE G2 M | 216 | 124 | All SZGR 2.0 genes in this pathway |