Gene Page: PTBP2
Summary ?
| GeneID | 58155 |
| Symbol | PTBP2 |
| Synonyms | PTBLP|brPTB|nPTB |
| Description | polypyrimidine tract binding protein 2 |
| Reference | MIM:608449|HGNC:HGNC:17662|Ensembl:ENSG00000117569|HPRD:12233|Vega:OTTHUMG00000010685 |
| Gene type | protein-coding |
| Map location | 1p21.3 |
| Pascal p-value | 2.229E-4 |
| Fetal beta | 1.737 |
Gene in Data Sources
| Gene set name | Method of gene set | Description | Info |
|---|---|---|---|
| CV:GWAScat | Genome-wide Association Studies | This data set includes 560 SNPs associated with schizophrenia. A total of 486 genes were mapped to these SNPs within 50kb. | |
| CV:GWASdb | Genome-wide Association Studies | GWASdb records for schizophrenia | |
| CV:PGCnp | Genome-wide Association Study | GWAS |
Section I. Genetics and epigenetics annotation
Section II. Transcriptome annotation
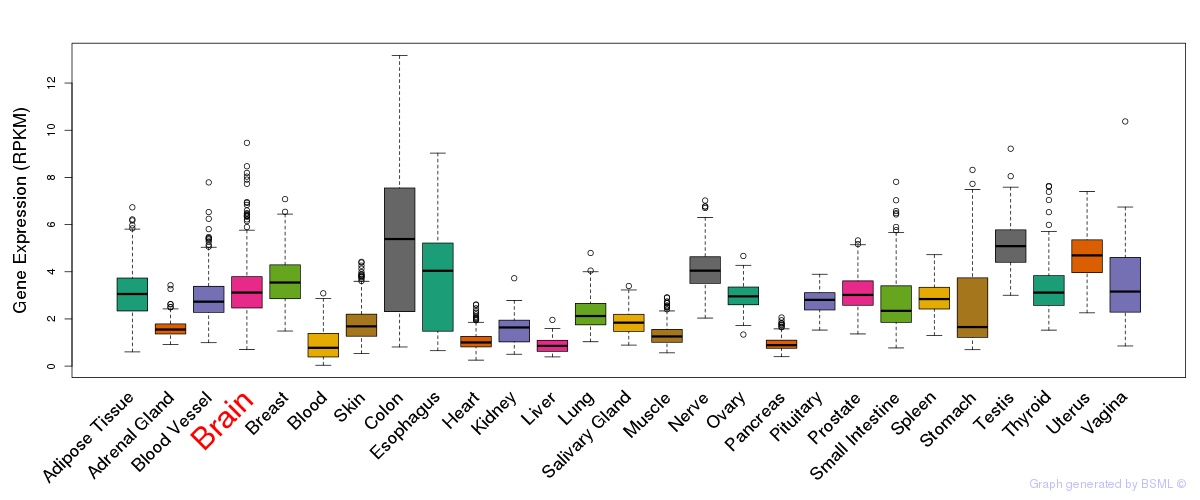
General gene expression (GTEx)

Gene expression during devlopment (BrainCloud)
Footnote:
A total of 269 time points ploted, with n=38 fetal samples (x=1:38). Each triangle represents one time point.
Gene expression of temporal and spatial changes (BrainSpan)
Footnote:
SC: sub-cortical regions; SM: sensory-motor regions; FC: frontal cortex; and TP: temporal-parietal cortex
ST1: fetal (13 - 26 postconception weeks), ST2: early infancy to late childhood (4 months to 11 years), and ST3: adolescence to adulthood (13 - 23 years)
The bar shown representes the lower 25% and upper 25% of the expression distribution.
Top co-expressed genes in brain regions
| Top 10 positively co-expressed genes | ||
| Gene | Pearson's Correlation | Spearman's Correlation |
| C10orf41 | 0.75 | 0.29 |
| RXRG | 0.72 | 0.49 |
| PDYN | 0.72 | 0.26 |
| GPR149 | 0.72 | 0.24 |
| RARB | 0.72 | 0.16 |
| PBX3 | 0.71 | 0.01 |
| FAM40B | 0.70 | 0.53 |
| SIX3 | 0.69 | 0.26 |
| EBF1 | 0.68 | 0.31 |
| CRABP1 | 0.67 | 0.40 |
| Top 10 negatively co-expressed genes | ||
| Gene | Pearson's Correlation | Spearman's Correlation |
| GTDC1 | -0.40 | -0.46 |
| GARNL3 | -0.39 | -0.52 |
| ZNF238 | -0.39 | -0.58 |
| LRFN2 | -0.38 | -0.47 |
| DPP4 | -0.38 | -0.54 |
| EMX1 | -0.38 | -0.54 |
| KHDRBS3 | -0.38 | -0.59 |
| GNAI1 | -0.38 | -0.50 |
| CBS | -0.37 | -0.52 |
| WWC1 | -0.37 | -0.47 |
Section V. Pathway annotation
| Pathway name | Pathway size | # SZGR 2.0 genes in pathway | Info |
|---|---|---|---|
| DAVICIONI MOLECULAR ARMS VS ERMS UP | 332 | 228 | All SZGR 2.0 genes in this pathway |
| THUM SYSTOLIC HEART FAILURE UP | 423 | 283 | All SZGR 2.0 genes in this pathway |
| UDAYAKUMAR MED1 TARGETS DN | 240 | 171 | All SZGR 2.0 genes in this pathway |
| HUMMEL BURKITTS LYMPHOMA UP | 43 | 27 | All SZGR 2.0 genes in this pathway |
| DODD NASOPHARYNGEAL CARCINOMA DN | 1375 | 806 | All SZGR 2.0 genes in this pathway |
| GRAESSMANN APOPTOSIS BY DOXORUBICIN DN | 1781 | 1082 | All SZGR 2.0 genes in this pathway |
| NUYTTEN EZH2 TARGETS UP | 1037 | 673 | All SZGR 2.0 genes in this pathway |
| BUYTAERT PHOTODYNAMIC THERAPY STRESS UP | 811 | 508 | All SZGR 2.0 genes in this pathway |
| GEORGES TARGETS OF MIR192 AND MIR215 | 893 | 528 | All SZGR 2.0 genes in this pathway |
| REN ALVEOLAR RHABDOMYOSARCOMA UP | 98 | 64 | All SZGR 2.0 genes in this pathway |
| LEE AGING CEREBELLUM UP | 84 | 58 | All SZGR 2.0 genes in this pathway |
| ACEVEDO LIVER CANCER UP | 973 | 570 | All SZGR 2.0 genes in this pathway |
| BHATI G2M ARREST BY 2METHOXYESTRADIOL UP | 125 | 68 | All SZGR 2.0 genes in this pathway |
| CHEN HOXA5 TARGETS 9HR UP | 223 | 132 | All SZGR 2.0 genes in this pathway |
| MELLMAN TUT1 TARGETS DN | 47 | 29 | All SZGR 2.0 genes in this pathway |
| BOYAULT LIVER CANCER SUBCLASS G3 UP | 188 | 121 | All SZGR 2.0 genes in this pathway |
| CAIRO LIVER DEVELOPMENT UP | 166 | 105 | All SZGR 2.0 genes in this pathway |
| JOHNSTONE PARVB TARGETS 3 DN | 918 | 550 | All SZGR 2.0 genes in this pathway |