Gene Page: NGB
Summary ?
| GeneID | 58157 |
| Symbol | NGB |
| Synonyms | - |
| Description | neuroglobin |
| Reference | MIM:605304|HGNC:HGNC:14077|Ensembl:ENSG00000165553|HPRD:05602|Vega:OTTHUMG00000171558 |
| Gene type | protein-coding |
| Map location | 14q24.3 |
| Pascal p-value | 0.282 |
| Sherlock p-value | 0.799 |
| Fetal beta | -2.443 |
| eGene | Myers' cis & trans |
Gene in Data Sources
| Gene set name | Method of gene set | Description | Info |
|---|---|---|---|
| CV:PGCnp | Genome-wide Association Study | GWAS | |
| PMID:cooccur | High-throughput literature-search | Systematic search in PubMed for genes co-occurring with SCZ keywords. A total of 3027 genes were included. | |
| Literature | High-throughput literature-search | Co-occurance with Schizophrenia keywords: schizophrenia,schizophrenias | Click to show details |
| Network | Shortest path distance of core genes in the Human protein-protein interaction network | Contribution to shortest path in PPI network: 0.0036 |
Section I. Genetics and epigenetics annotation
 eQTL annotation
| SNP ID | Chromosome | Position | eGene | Gene Entrez ID | pvalue | qvalue | TSS distance | eQTL type |
|---|---|---|---|---|---|---|---|---|
| rs2151616 | chr9 | 101729102 | NGB | 58157 | 0.17 | trans | ||
| rs6132977 | chr20 | 2825971 | NGB | 58157 | 0.16 | trans |
Section II. Transcriptome annotation
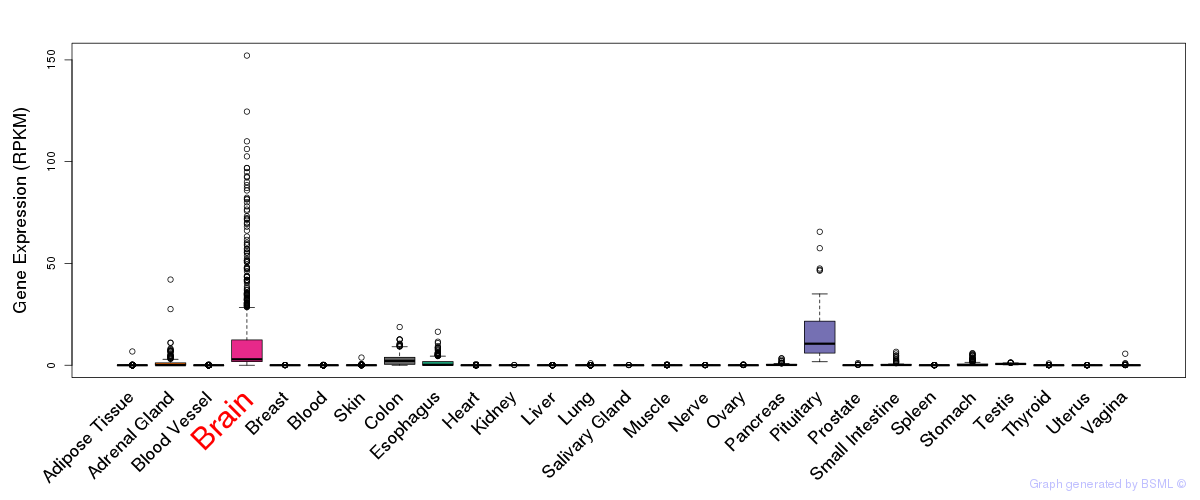
General gene expression (GTEx)
Gene expression during devlopment (BrainCloud)
Footnote:
A total of 269 time points ploted, with n=38 fetal samples (x=1:38). Each triangle represents one time point.
Gene expression of temporal and spatial changes (BrainSpan)
Footnote:
SC: sub-cortical regions; SM: sensory-motor regions; FC: frontal cortex; and TP: temporal-parietal cortex
ST1: fetal (13 - 26 postconception weeks), ST2: early infancy to late childhood (4 months to 11 years), and ST3: adolescence to adulthood (13 - 23 years)
The bar shown representes the lower 25% and upper 25% of the expression distribution.
Top co-expressed genes in brain regions
| Top 10 positively co-expressed genes | ||
| Gene | Pearson's Correlation | Spearman's Correlation |
| C4orf27 | 0.86 | 0.85 |
| RG9MTD1 | 0.85 | 0.86 |
| PSMA4 | 0.84 | 0.87 |
| TIMM9 | 0.84 | 0.85 |
| RBM34 | 0.84 | 0.85 |
| DPM1 | 0.84 | 0.87 |
| BXDC2 | 0.84 | 0.83 |
| C7orf36 | 0.84 | 0.84 |
| CWC15 | 0.83 | 0.87 |
| FRG1 | 0.83 | 0.80 |
| Top 10 negatively co-expressed genes | ||
| Gene | Pearson's Correlation | Spearman's Correlation |
| AF347015.15 | -0.59 | -0.61 |
| MT-CYB | -0.59 | -0.59 |
| AF347015.2 | -0.59 | -0.61 |
| AF347015.26 | -0.58 | -0.63 |
| AF347015.8 | -0.57 | -0.58 |
| AF347015.27 | -0.56 | -0.56 |
| SEMA3G | -0.56 | -0.62 |
| AF347015.33 | -0.56 | -0.57 |
| MT-CO2 | -0.56 | -0.54 |
| ENG | -0.55 | -0.59 |
Section III. Gene Ontology annotation
| Molecular function | GO term | Evidence | Neuro keywords | PubMed ID |
|---|---|---|---|---|
| GO:0005506 | iron ion binding | IEA | - | |
| GO:0005344 | oxygen transporter activity | TAS | 11029004 | |
| GO:0019825 | oxygen binding | IEA | - | |
| GO:0020037 | heme binding | IEA | - | |
| GO:0046872 | metal ion binding | IEA | - | |
| Biological process | GO term | Evidence | Neuro keywords | PubMed ID |
| GO:0006810 | transport | IEA | - | |
| GO:0015671 | oxygen transport | NAS | 11029004 | |
| Cellular component | GO term | Evidence | Neuro keywords | PubMed ID |
| GO:0005833 | hemoglobin complex | NAS | - |
Section V. Pathway annotation
| Pathway name | Pathway size | # SZGR 2.0 genes in pathway | Info |
|---|---|---|---|
| BENPORATH SUZ12 TARGETS | 1038 | 678 | All SZGR 2.0 genes in this pathway |
| BENPORATH EED TARGETS | 1062 | 725 | All SZGR 2.0 genes in this pathway |
| BENPORATH MYC MAX TARGETS | 775 | 494 | All SZGR 2.0 genes in this pathway |
| MEISSNER NPC HCP WITH H3 UNMETHYLATED | 536 | 296 | All SZGR 2.0 genes in this pathway |
| DANG BOUND BY MYC | 1103 | 714 | All SZGR 2.0 genes in this pathway |
| MIKKELSEN MEF HCP WITH H3K27ME3 | 590 | 403 | All SZGR 2.0 genes in this pathway |
| MARTENS TRETINOIN RESPONSE UP | 857 | 456 | All SZGR 2.0 genes in this pathway |