Gene Page: DNASE2B
Summary ?
| GeneID | 58511 |
| Symbol | DNASE2B |
| Synonyms | DLAD |
| Description | deoxyribonuclease II beta |
| Reference | MIM:608057|HGNC:HGNC:28875|Ensembl:ENSG00000137976|HPRD:09728|Vega:OTTHUMG00000009860 |
| Gene type | protein-coding |
| Map location | 1p22.3 |
| Pascal p-value | 0.29 |
| Fetal beta | 0.241 |
Gene in Data Sources
| Gene set name | Method of gene set | Description | Info |
|---|---|---|---|
| CV:PGCnp | Genome-wide Association Study | GWAS | |
| DNM:Gulsuner_2013 | Whole Exome Sequencing analysis | 155 DNMs identified by exome sequencing of quads or trios of schizophrenia individuals and their parents. |
Section I. Genetics and epigenetics annotation
 DNM table
| Gene | Chromosome | Position | Ref | Alt | Transcript | AA change | Mutation type | Sift | CG46 | Trait | Study |
|---|---|---|---|---|---|---|---|---|---|---|---|
| DNASE2B | chr1 | 84878061 | G | A | NM_021233 NM_058248 | p.193V>I . | missense 5-UTR | Schizophrenia | DNM:Gulsuner_2013 |
Section II. Transcriptome annotation
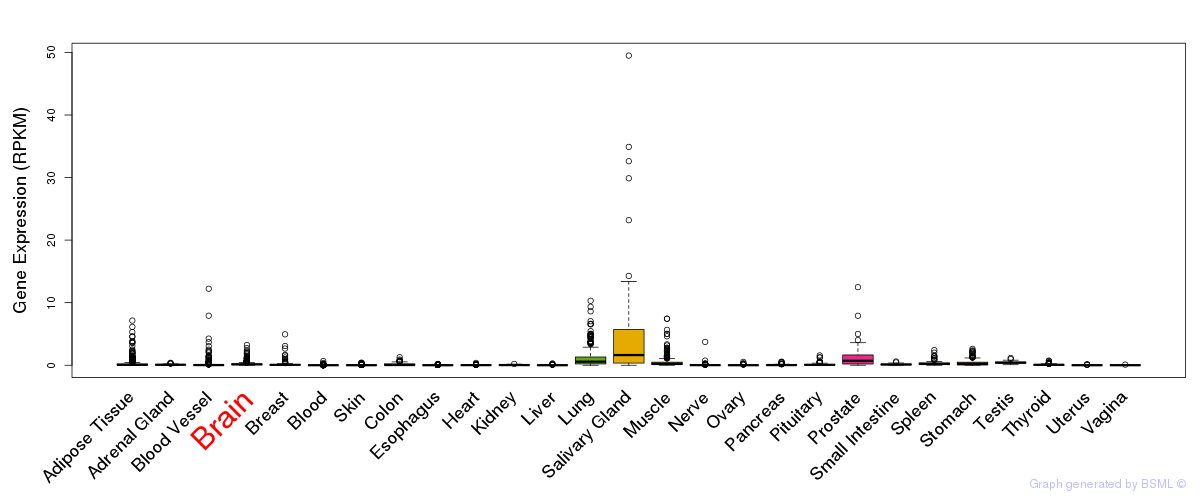
General gene expression (GTEx)
Gene expression during devlopment (BrainCloud)
Footnote:
A total of 269 time points ploted, with n=38 fetal samples (x=1:38). Each triangle represents one time point.
Gene expression of temporal and spatial changes (BrainSpan)
Footnote:
SC: sub-cortical regions; SM: sensory-motor regions; FC: frontal cortex; and TP: temporal-parietal cortex
ST1: fetal (13 - 26 postconception weeks), ST2: early infancy to late childhood (4 months to 11 years), and ST3: adolescence to adulthood (13 - 23 years)
The bar shown representes the lower 25% and upper 25% of the expression distribution.
Top co-expressed genes in brain regions
| Top 10 positively co-expressed genes | ||
| Gene | Pearson's Correlation | Spearman's Correlation |
| ATRN | 0.91 | 0.92 |
| C11orf41 | 0.90 | 0.92 |
| NF1 | 0.90 | 0.92 |
| PIKFYVE | 0.90 | 0.92 |
| SAMD8 | 0.90 | 0.91 |
| PLEKHM3 | 0.89 | 0.93 |
| WDR37 | 0.89 | 0.92 |
| ZNF295 | 0.89 | 0.92 |
| SORBS2 | 0.89 | 0.91 |
| WDFY3 | 0.89 | 0.92 |
| Top 10 negatively co-expressed genes | ||
| Gene | Pearson's Correlation | Spearman's Correlation |
| FXYD1 | -0.63 | -0.68 |
| HIGD1B | -0.62 | -0.69 |
| AF347015.21 | -0.61 | -0.71 |
| AF347015.31 | -0.61 | -0.68 |
| TLCD1 | -0.61 | -0.65 |
| MT-CO2 | -0.60 | -0.68 |
| C1orf54 | -0.60 | -0.75 |
| S100A16 | -0.60 | -0.66 |
| CST3 | -0.59 | -0.65 |
| ENHO | -0.59 | -0.67 |
Section V. Pathway annotation
| Pathway name | Pathway size | # SZGR 2.0 genes in pathway | Info |
|---|---|---|---|
| KEGG LYSOSOME | 121 | 83 | All SZGR 2.0 genes in this pathway |
| DOANE RESPONSE TO ANDROGEN UP | 184 | 125 | All SZGR 2.0 genes in this pathway |
| INGRAM SHH TARGETS UP | 127 | 79 | All SZGR 2.0 genes in this pathway |
| HADDAD B LYMPHOCYTE PROGENITOR | 293 | 193 | All SZGR 2.0 genes in this pathway |
| ACEVEDO LIVER CANCER WITH H3K27ME3 UP | 295 | 149 | All SZGR 2.0 genes in this pathway |
| ACEVEDO LIVER CANCER WITH H3K9ME3 UP | 141 | 75 | All SZGR 2.0 genes in this pathway |
| BOCHKIS FOXA2 TARGETS | 425 | 261 | All SZGR 2.0 genes in this pathway |
| LABBE WNT3A TARGETS DN | 97 | 53 | All SZGR 2.0 genes in this pathway |
| ZWANG TRANSIENTLY UP BY 1ST EGF PULSE ONLY | 1839 | 928 | All SZGR 2.0 genes in this pathway |