Gene Page: SELK
Summary ?
| GeneID | 58515 |
| Symbol | SELK |
| Synonyms | HSPC030|HSPC297|SelK |
| Description | selenoprotein K |
| Reference | MIM:607916|Ensembl:ENSG00000113811|HPRD:07448| |
| Gene type | protein-coding |
| Map location | 3p21.31 |
| Pascal p-value | 0.164 |
| Sherlock p-value | 0.993 |
| Fetal beta | -0.664 |
| DMG | 1 (# studies) |
Gene in Data Sources
| Gene set name | Method of gene set | Description | Info |
|---|---|---|---|
| CV:PGCnp | Genome-wide Association Study | GWAS | |
| DMG:Jaffe_2016 | Genome-wide DNA methylation analysis | This dataset includes 2,104 probes/CpGs associated with SZ patients (n=108) compared to 136 controls at Bonferroni-adjusted P < 0.05. | 2 |
Section I. Genetics and epigenetics annotation
 Differentially methylated gene
| Probe | Chromosome | Position | Nearest gene | P (dis) | Beta (dis) | FDR (dis) | Study |
|---|---|---|---|---|---|---|---|
| cg02759005 | 3 | 53925912 | SELK | 7.32E-11 | -0.017 | 4.34E-7 | DMG:Jaffe_2016 |
| cg18580327 | 3 | 53925981 | SELK | 6.93E-9 | -0.009 | 3.53E-6 | DMG:Jaffe_2016 |
Section II. Transcriptome annotation
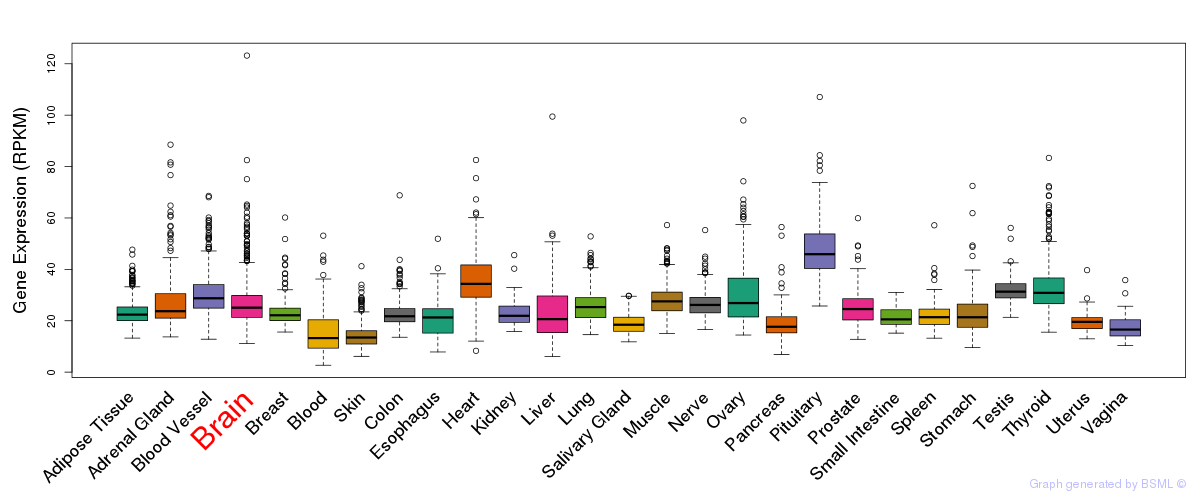
General gene expression (GTEx)
Gene expression during devlopment (BrainCloud)
Footnote:
A total of 269 time points ploted, with n=38 fetal samples (x=1:38). Each triangle represents one time point.
Gene expression of temporal and spatial changes (BrainSpan)
Footnote:
SC: sub-cortical regions; SM: sensory-motor regions; FC: frontal cortex; and TP: temporal-parietal cortex
ST1: fetal (13 - 26 postconception weeks), ST2: early infancy to late childhood (4 months to 11 years), and ST3: adolescence to adulthood (13 - 23 years)
The bar shown representes the lower 25% and upper 25% of the expression distribution.
Top co-expressed genes in brain regions
| Top 10 positively co-expressed genes | ||
| Gene | Pearson's Correlation | Spearman's Correlation |
| EIF5A | 0.89 | 0.90 |
| RRP9 | 0.89 | 0.91 |
| TIMM44 | 0.89 | 0.90 |
| NOL12 | 0.89 | 0.89 |
| DCTPP1 | 0.88 | 0.92 |
| MED19 | 0.88 | 0.89 |
| EXOSC7 | 0.88 | 0.89 |
| ITPA | 0.88 | 0.90 |
| TSTA3 | 0.88 | 0.89 |
| PDRG1 | 0.88 | 0.91 |
| Top 10 negatively co-expressed genes | ||
| Gene | Pearson's Correlation | Spearman's Correlation |
| AF347015.27 | -0.77 | -0.82 |
| MT-CYB | -0.77 | -0.82 |
| AF347015.8 | -0.76 | -0.81 |
| AF347015.33 | -0.76 | -0.81 |
| AF347015.15 | -0.76 | -0.83 |
| MT-CO2 | -0.76 | -0.79 |
| AF347015.31 | -0.76 | -0.79 |
| AF347015.2 | -0.75 | -0.82 |
| AF347015.26 | -0.74 | -0.82 |
| AF347015.9 | -0.70 | -0.79 |
Section V. Pathway annotation
| Pathway name | Pathway size | # SZGR 2.0 genes in pathway | Info |
|---|---|---|---|
| GARY CD5 TARGETS DN | 431 | 263 | All SZGR 2.0 genes in this pathway |
| OSMAN BLADDER CANCER DN | 406 | 230 | All SZGR 2.0 genes in this pathway |
| BYSTRYKH HEMATOPOIESIS STEM CELL QTL TRANS | 882 | 572 | All SZGR 2.0 genes in this pathway |
| NOUZOVA TRETINOIN AND H4 ACETYLATION | 143 | 85 | All SZGR 2.0 genes in this pathway |
| GAVIN FOXP3 TARGETS CLUSTER T4 | 94 | 69 | All SZGR 2.0 genes in this pathway |
| ROME INSULIN TARGETS IN MUSCLE UP | 442 | 263 | All SZGR 2.0 genes in this pathway |
| JOHNSTONE PARVB TARGETS 3 DN | 918 | 550 | All SZGR 2.0 genes in this pathway |
| PURBEY TARGETS OF CTBP1 NOT SATB1 DN | 448 | 282 | All SZGR 2.0 genes in this pathway |
| WAKABAYASHI ADIPOGENESIS PPARG RXRA BOUND 8D | 882 | 506 | All SZGR 2.0 genes in this pathway |