Gene Page: RABIF
Summary ?
| GeneID | 5877 |
| Symbol | RABIF |
| Synonyms | MSS4|RASGFR3|RASGRF3 |
| Description | RAB interacting factor |
| Reference | MIM:603417|HGNC:HGNC:9797|HPRD:04566| |
| Gene type | protein-coding |
| Map location | 1q32.1 |
| Fetal beta | -0.184 |
| DMG | 1 (# studies) |
| Support | INTRACELLULAR TRAFFICKING |
Gene in Data Sources
| Gene set name | Method of gene set | Description | Info |
|---|---|---|---|
| DMG:Jaffe_2016 | Genome-wide DNA methylation analysis | This dataset includes 2,104 probes/CpGs associated with SZ patients (n=108) compared to 136 controls at Bonferroni-adjusted P < 0.05. | 1 |
Section I. Genetics and epigenetics annotation
 Differentially methylated gene
| Probe | Chromosome | Position | Nearest gene | P (dis) | Beta (dis) | FDR (dis) | Study |
|---|---|---|---|---|---|---|---|
| cg21690091 | 1 | 202830756 | RABIF | 1.02E-10 | -0.011 | 4.55E-7 | DMG:Jaffe_2016 |
Section II. Transcriptome annotation
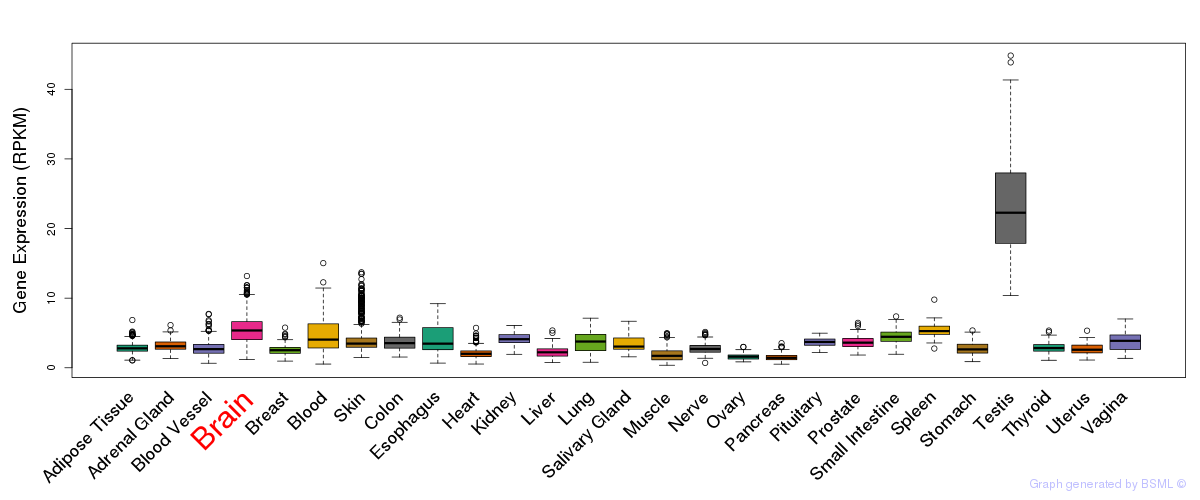
General gene expression (GTEx)
Gene expression during devlopment (BrainCloud)
Footnote:
A total of 269 time points ploted, with n=38 fetal samples (x=1:38). Each triangle represents one time point.
Gene expression of temporal and spatial changes (BrainSpan)
Footnote:
SC: sub-cortical regions; SM: sensory-motor regions; FC: frontal cortex; and TP: temporal-parietal cortex
ST1: fetal (13 - 26 postconception weeks), ST2: early infancy to late childhood (4 months to 11 years), and ST3: adolescence to adulthood (13 - 23 years)
The bar shown representes the lower 25% and upper 25% of the expression distribution.
Top co-expressed genes in brain regions
| Top 10 positively co-expressed genes | ||
| Gene | Pearson's Correlation | Spearman's Correlation |
| LRPAP1 | 0.86 | 0.84 |
| NGEF | 0.85 | 0.83 |
| NCDN | 0.85 | 0.89 |
| RP5-1187M17.1 | 0.84 | 0.89 |
| ABLIM2 | 0.84 | 0.92 |
| HTR6 | 0.83 | 0.84 |
| INF2 | 0.83 | 0.77 |
| ADCY3 | 0.83 | 0.80 |
| ENTPD3 | 0.82 | 0.82 |
| FBXL16 | 0.82 | 0.80 |
| Top 10 negatively co-expressed genes | ||
| Gene | Pearson's Correlation | Spearman's Correlation |
| DBI | -0.35 | -0.38 |
| RAB13 | -0.35 | -0.48 |
| SPINK8 | -0.34 | -0.37 |
| RPS20 | -0.34 | -0.45 |
| RPL34 | -0.34 | -0.44 |
| BCL7C | -0.34 | -0.44 |
| FAM159B | -0.33 | -0.57 |
| AF347015.21 | -0.33 | -0.21 |
| AF347015.18 | -0.33 | -0.20 |
| RPL38 | -0.32 | -0.46 |
Section V. Pathway annotation
| Pathway name | Pathway size | # SZGR 2.0 genes in pathway | Info |
|---|---|---|---|
| ENK UV RESPONSE KERATINOCYTE DN | 485 | 334 | All SZGR 2.0 genes in this pathway |
| GRAESSMANN APOPTOSIS BY DOXORUBICIN DN | 1781 | 1082 | All SZGR 2.0 genes in this pathway |
| GRAESSMANN RESPONSE TO MC AND DOXORUBICIN DN | 770 | 415 | All SZGR 2.0 genes in this pathway |
| SCHLOSSER SERUM RESPONSE DN | 712 | 443 | All SZGR 2.0 genes in this pathway |
| SPIELMAN LYMPHOBLAST EUROPEAN VS ASIAN DN | 584 | 395 | All SZGR 2.0 genes in this pathway |
| BUYTAERT PHOTODYNAMIC THERAPY STRESS DN | 637 | 377 | All SZGR 2.0 genes in this pathway |
| LOPEZ MBD TARGETS | 957 | 597 | All SZGR 2.0 genes in this pathway |
| STONER ESOPHAGEAL CARCINOGENESIS DN | 7 | 6 | All SZGR 2.0 genes in this pathway |
| THEILGAARD NEUTROPHIL AT SKIN WOUND DN | 225 | 163 | All SZGR 2.0 genes in this pathway |
| STEIN ESRRA TARGETS DN | 105 | 63 | All SZGR 2.0 genes in this pathway |
| WALLACE PROSTATE CANCER RACE DN | 88 | 42 | All SZGR 2.0 genes in this pathway |
| YOSHIMURA MAPK8 TARGETS UP | 1305 | 895 | All SZGR 2.0 genes in this pathway |
| HAN SATB1 TARGETS UP | 395 | 249 | All SZGR 2.0 genes in this pathway |
| ZHAN VARIABLE EARLY DIFFERENTIATION GENES DN | 30 | 19 | All SZGR 2.0 genes in this pathway |
| BOYAULT LIVER CANCER SUBCLASS G1 UP | 113 | 70 | All SZGR 2.0 genes in this pathway |
| STEIN ESRRA TARGETS | 535 | 325 | All SZGR 2.0 genes in this pathway |
| DANG REGULATED BY MYC DN | 253 | 192 | All SZGR 2.0 genes in this pathway |
| PILON KLF1 TARGETS DN | 1972 | 1213 | All SZGR 2.0 genes in this pathway |
| BRUINS UVC RESPONSE VIA TP53 GROUP A | 898 | 516 | All SZGR 2.0 genes in this pathway |
| ZWANG TRANSIENTLY UP BY 1ST EGF PULSE ONLY | 1839 | 928 | All SZGR 2.0 genes in this pathway |