Gene Page: CPLX3
Summary ?
| GeneID | 594855 |
| Symbol | CPLX3 |
| Synonyms | CPX-III|CPXIII|Nbla11589 |
| Description | complexin 3 |
| Reference | MIM:609585|HGNC:HGNC:27652|Ensembl:ENSG00000213578|Vega:OTTHUMG00000142816 |
| Gene type | protein-coding |
| Map location | 15q24.1 |
| Pascal p-value | 0.015 |
| Fetal beta | -0.935 |
| DMG | 1 (# studies) |
Gene in Data Sources
| Gene set name | Method of gene set | Description | Info |
|---|---|---|---|
| CV:PGCnp | Genome-wide Association Study | GWAS | |
| DMG:Wockner_2014 | Genome-wide DNA methylation analysis | This dataset includes 4641 differentially methylated probes corresponding to 2929 unique genes between schizophrenia patients (n=24) and controls (n=24). | 1 |
| DNM:McCarthy_2014 | Whole Exome Sequencing analysis | Whole exome sequencing of 57 trios with sporadic or familial schizophrenia. | |
| GO_Annotation | Mapping neuro-related keywords to Gene Ontology annotations | Hits with neuro-related keywords: 4 |
Section I. Genetics and epigenetics annotation
 DNM table
| Gene | Chromosome | Position | Ref | Alt | Transcript | AA change | Mutation type | Sift | CG46 | Trait | Study |
|---|---|---|---|---|---|---|---|---|---|---|---|
| CPLX3 | chr15 | 75122680 | G | A | NM_001030005 | p.K154K | synonymous SNV | Schizophrenia | DNM:McCarthy_2014 |
Differentially methylated gene
| Probe | Chromosome | Position | Nearest gene | P (dis) | Beta (dis) | FDR (dis) | Study |
|---|---|---|---|---|---|---|---|
| cg12791555 | 15 | 75118714 | CPLX3 | 2.536E-4 | -0.503 | 0.037 | DMG:Wockner_2014 |
Section II. Transcriptome annotation
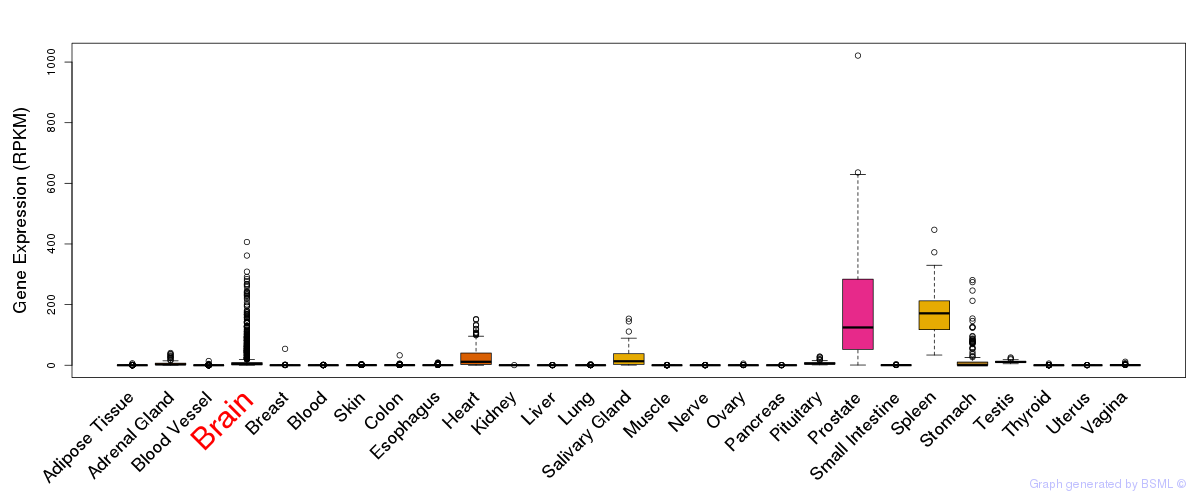
General gene expression (GTEx)
Gene expression during devlopment (BrainCloud)
Footnote:
A total of 269 time points ploted, with n=38 fetal samples (x=1:38). Each triangle represents one time point.
Gene expression of temporal and spatial changes (BrainSpan)
Footnote:
SC: sub-cortical regions; SM: sensory-motor regions; FC: frontal cortex; and TP: temporal-parietal cortex
ST1: fetal (13 - 26 postconception weeks), ST2: early infancy to late childhood (4 months to 11 years), and ST3: adolescence to adulthood (13 - 23 years)
The bar shown representes the lower 25% and upper 25% of the expression distribution.
No co-expressed genes in brain regions
Section III. Gene Ontology annotation
| Molecular function | GO term | Evidence | Neuro keywords | PubMed ID |
|---|---|---|---|---|
| GO:0019905 | syntaxin binding | IEA | Synap (GO term level: 5) | - |
| GO:0005326 | neurotransmitter transporter activity | IEA | neuron, Neurotransmitter (GO term level: 3) | - |
| Biological process | GO term | Evidence | Neuro keywords | PubMed ID |
| GO:0046928 | regulation of neurotransmitter secretion | IEA | Synap, Neurotransmitter (GO term level: 9) | - |
| GO:0016079 | synaptic vesicle exocytosis | IEA | neuron, Synap, Neurotransmitter (GO term level: 9) | - |
| GO:0006836 | neurotransmitter transport | IEA | neuron, Neurotransmitter (GO term level: 5) | - |
| GO:0030073 | insulin secretion | IEA | - | |
| Cellular component | GO term | Evidence | Neuro keywords | PubMed ID |
| GO:0045202 | synapse | IEA | neuron, Synap, Neurotransmitter, Glial (GO term level: 2) | - |
| GO:0005829 | cytosol | IEA | - | |
| GO:0005886 | plasma membrane | IEA | - | |
| GO:0030054 | cell junction | IEA | - |
Section V. Pathway annotation
| Pathway name | Pathway size | # SZGR 2.0 genes in pathway | Info |
|---|---|---|---|
| MIKKELSEN MEF ICP WITH H3K27ME3 | 206 | 108 | All SZGR 2.0 genes in this pathway |
| MIKKELSEN IPS ICP WITH H3K27ME3 | 54 | 32 | All SZGR 2.0 genes in this pathway |
| MIKKELSEN ES ICP WITH H3K27ME3 | 42 | 27 | All SZGR 2.0 genes in this pathway |
Section VI. microRNA annotation
| miRNA family | Target position | miRNA ID | miRNA seq | ||
|---|---|---|---|---|---|
| UTR start | UTR end | Match method | |||
| miR-148/152 | 738 | 744 | 1A | hsa-miR-148a | UCAGUGCACUACAGAACUUUGU |
| hsa-miR-152brain | UCAGUGCAUGACAGAACUUGGG | ||||
| hsa-miR-148b | UCAGUGCAUCACAGAACUUUGU | ||||
| miR-342 | 706 | 713 | 1A,m8 | hsa-miR-342brain | UCUCACACAGAAAUCGCACCCGUC |
| miR-377 | 705 | 711 | m8 | hsa-miR-377 | AUCACACAAAGGCAACUUUUGU |
- SZ: miRNAs which differentially expressed in brain cortex of schizophrenia patients comparing with control samples using microarray. Click here to see the list of SZ related miRNAs.
- Brain: miRNAs which are expressed in brain based on miRNA microarray expression studies. Click here to see the list of brain related miRNAs.