Gene Page: PAPPA2
Summary ?
| GeneID | 60676 |
| Symbol | PAPPA2 |
| Synonyms | PAPP-A2|PAPP-E|PAPPE|PLAC3 |
| Description | pappalysin 2 |
| Reference | HGNC:HGNC:14615|Ensembl:ENSG00000116183|HPRD:10156|Vega:OTTHUMG00000035025 |
| Gene type | protein-coding |
| Map location | 1q25.2 |
| Fetal beta | 0.468 |
| DMG | 1 (# studies) |
| eGene | Cerebellar Hemisphere |
| Support | CompositeSet |
Gene in Data Sources
| Gene set name | Method of gene set | Description | Info |
|---|---|---|---|
| CV:PGCnp | Genome-wide Association Study | GWAS | |
| DMG:Wockner_2014 | Genome-wide DNA methylation analysis | This dataset includes 4641 differentially methylated probes corresponding to 2929 unique genes between schizophrenia patients (n=24) and controls (n=24). | 1 |
| DNM:Xu_2012 | Whole Exome Sequencing analysis | De novo mutations of 4 genes were identified by exome sequencing of 795 samples in this study |
Section I. Genetics and epigenetics annotation
 DNM table
| Gene | Chromosome | Position | Ref | Alt | Transcript | AA change | Mutation type | Sift | CG46 | Trait | Study |
|---|---|---|---|---|---|---|---|---|---|---|---|
| PAPPA2 | chr1 | 176526125 | C | T | NM_020318 NM_021936 | p.223P>S p.223P>S | missense missense | Schizophrenia | DNM:Xu_2012 |
Differentially methylated gene
| Probe | Chromosome | Position | Nearest gene | P (dis) | Beta (dis) | FDR (dis) | Study |
|---|---|---|---|---|---|---|---|
| cg02051981 | 1 | 176432162 | PAPPA2 | 8.7E-5 | 0.294 | 0.026 | DMG:Wockner_2014 |
Section II. Transcriptome annotation
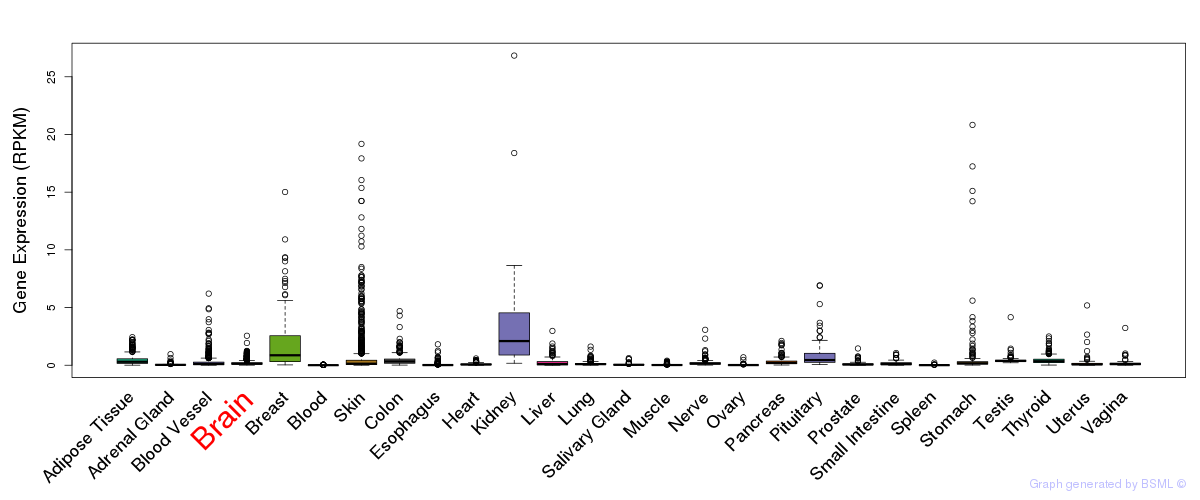
General gene expression (GTEx)
Gene expression during devlopment (BrainCloud)
Footnote:
A total of 269 time points ploted, with n=38 fetal samples (x=1:38). Each triangle represents one time point.
Gene expression of temporal and spatial changes (BrainSpan)
Footnote:
SC: sub-cortical regions; SM: sensory-motor regions; FC: frontal cortex; and TP: temporal-parietal cortex
ST1: fetal (13 - 26 postconception weeks), ST2: early infancy to late childhood (4 months to 11 years), and ST3: adolescence to adulthood (13 - 23 years)
The bar shown representes the lower 25% and upper 25% of the expression distribution.
No co-expressed genes in brain regions
Section V. Pathway annotation
| Pathway name | Pathway size | # SZGR 2.0 genes in pathway | Info |
|---|---|---|---|
| REACTOME DIABETES PATHWAYS | 133 | 91 | All SZGR 2.0 genes in this pathway |
| REACTOME REGULATION OF INSULIN LIKE GROWTH FACTOR IGF ACTIVITY BY INSULIN LIKE GROWTH FACTOR BINDING PROTEINS IGFBPS | 16 | 12 | All SZGR 2.0 genes in this pathway |
| DEURIG T CELL PROLYMPHOCYTIC LEUKEMIA UP | 368 | 234 | All SZGR 2.0 genes in this pathway |
| EBAUER TARGETS OF PAX3 FOXO1 FUSION UP | 207 | 128 | All SZGR 2.0 genes in this pathway |
| FLECHNER BIOPSY KIDNEY TRANSPLANT OK VS DONOR UP | 555 | 346 | All SZGR 2.0 genes in this pathway |
| BLALOCK ALZHEIMERS DISEASE UP | 1691 | 1088 | All SZGR 2.0 genes in this pathway |
| RODWELL AGING KIDNEY NO BLOOD UP | 222 | 139 | All SZGR 2.0 genes in this pathway |
| SU PLACENTA | 30 | 18 | All SZGR 2.0 genes in this pathway |
| IWANAGA CARCINOGENESIS BY KRAS PTEN DN | 353 | 226 | All SZGR 2.0 genes in this pathway |
| HAN SATB1 TARGETS UP | 395 | 249 | All SZGR 2.0 genes in this pathway |
| KATSANOU ELAVL1 TARGETS UP | 169 | 105 | All SZGR 2.0 genes in this pathway |
| ACEVEDO FGFR1 TARGETS IN PROSTATE CANCER MODEL DN | 308 | 187 | All SZGR 2.0 genes in this pathway |
| NABA ECM REGULATORS | 238 | 125 | All SZGR 2.0 genes in this pathway |
| NABA MATRISOME ASSOCIATED | 753 | 411 | All SZGR 2.0 genes in this pathway |
| NABA MATRISOME | 1028 | 559 | All SZGR 2.0 genes in this pathway |