Gene Page: EEFSEC
Summary ?
| GeneID | 60678 |
| Symbol | EEFSEC |
| Synonyms | EFSEC|SELB |
| Description | eukaryotic elongation factor, selenocysteine-tRNA-specific |
| Reference | MIM:607695|HGNC:HGNC:24614|Ensembl:ENSG00000132394|HPRD:07409|Vega:OTTHUMG00000159659 |
| Gene type | protein-coding |
| Map location | 3q21.3 |
| Pascal p-value | 0.001 |
| Sherlock p-value | 0.76 |
| Fetal beta | 0.231 |
| DMG | 1 (# studies) |
| eGene | Myers' cis & trans |
Gene in Data Sources
| Gene set name | Method of gene set | Description | Info |
|---|---|---|---|
| CV:GWASdb | Genome-wide Association Studies | GWASdb records for schizophrenia | |
| CV:PGCnp | Genome-wide Association Study | GWAS | |
| DMG:Jaffe_2016 | Genome-wide DNA methylation analysis | This dataset includes 2,104 probes/CpGs associated with SZ patients (n=108) compared to 136 controls at Bonferroni-adjusted P < 0.05. | 1 |
Section I. Genetics and epigenetics annotation
 Differentially methylated gene
| Probe | Chromosome | Position | Nearest gene | P (dis) | Beta (dis) | FDR (dis) | Study |
|---|---|---|---|---|---|---|---|
| cg27394987 | 3 | 128118189 | EEFSEC | 9.64E-9 | 0.025 | 4.27E-6 | DMG:Jaffe_2016 |
eQTL annotation
| SNP ID | Chromosome | Position | eGene | Gene Entrez ID | pvalue | qvalue | TSS distance | eQTL type |
|---|---|---|---|---|---|---|---|---|
| rs6692851 | chr1 | 34346561 | EEFSEC | 60678 | 0.13 | trans |
Section II. Transcriptome annotation
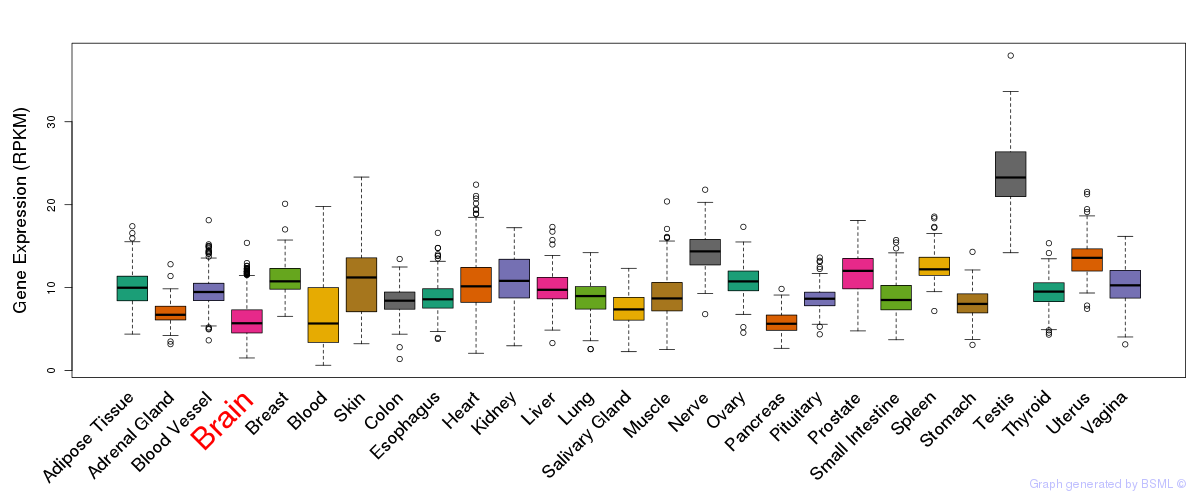
General gene expression (GTEx)
Gene expression during devlopment (BrainCloud)
Footnote:
A total of 269 time points ploted, with n=38 fetal samples (x=1:38). Each triangle represents one time point.
Gene expression of temporal and spatial changes (BrainSpan)
Footnote:
SC: sub-cortical regions; SM: sensory-motor regions; FC: frontal cortex; and TP: temporal-parietal cortex
ST1: fetal (13 - 26 postconception weeks), ST2: early infancy to late childhood (4 months to 11 years), and ST3: adolescence to adulthood (13 - 23 years)
The bar shown representes the lower 25% and upper 25% of the expression distribution.
Top co-expressed genes in brain regions
| Top 10 positively co-expressed genes | ||
| Gene | Pearson's Correlation | Spearman's Correlation |
| STRA6 | 0.86 | 0.79 |
| PCDH12 | 0.79 | 0.76 |
| COL4A2 | 0.77 | 0.79 |
| COL4A1 | 0.76 | 0.78 |
| NID1 | 0.76 | 0.77 |
| MMP2 | 0.75 | 0.76 |
| COL6A2 | 0.75 | 0.63 |
| CD248 | 0.75 | 0.64 |
| PCOLCE | 0.74 | 0.59 |
| FLVCR2 | 0.74 | 0.58 |
| Top 10 negatively co-expressed genes | ||
| Gene | Pearson's Correlation | Spearman's Correlation |
| C5orf53 | -0.46 | -0.55 |
| AF347015.27 | -0.44 | -0.55 |
| AF347015.33 | -0.44 | -0.56 |
| CSRP1 | -0.43 | -0.46 |
| MT-CO2 | -0.43 | -0.55 |
| CYP2J2 | -0.43 | -0.53 |
| AF347015.31 | -0.42 | -0.53 |
| HLA-F | -0.42 | -0.44 |
| SEPT4 | -0.42 | -0.52 |
| PIR | -0.42 | -0.53 |
Section V. Pathway annotation
| Pathway name | Pathway size | # SZGR 2.0 genes in pathway | Info |
|---|---|---|---|
| GRADE COLON CANCER UP | 871 | 505 | All SZGR 2.0 genes in this pathway |
| FEVR CTNNB1 TARGETS DN | 553 | 343 | All SZGR 2.0 genes in this pathway |