Gene Page: RPS13
Summary ?
| GeneID | 6207 |
| Symbol | RPS13 |
| Synonyms | S13 |
| Description | ribosomal protein S13 |
| Reference | MIM:180476|HGNC:HGNC:10386|Ensembl:ENSG00000110700|HPRD:01604|Vega:OTTHUMG00000165988 |
| Gene type | protein-coding |
| Map location | 11p15 |
| Pascal p-value | 5.451E-4 |
| Fetal beta | 1.328 |
| DMG | 1 (# studies) |
| Support | G2Cdb.humanPSD G2Cdb.humanPSP CompositeSet |
Gene in Data Sources
| Gene set name | Method of gene set | Description | Info |
|---|---|---|---|
| CV:PGCnp | Genome-wide Association Study | GWAS | |
| DMG:Jaffe_2016 | Genome-wide DNA methylation analysis | This dataset includes 2,104 probes/CpGs associated with SZ patients (n=108) compared to 136 controls at Bonferroni-adjusted P < 0.05. | 1 |
Section I. Genetics and epigenetics annotation
 Differentially methylated gene
| Probe | Chromosome | Position | Nearest gene | P (dis) | Beta (dis) | FDR (dis) | Study |
|---|---|---|---|---|---|---|---|
| cg05173385 | 11 | 17099044 | RPS13 | 1.66E-10 | -0.019 | 5.14E-7 | DMG:Jaffe_2016 |
Section II. Transcriptome annotation
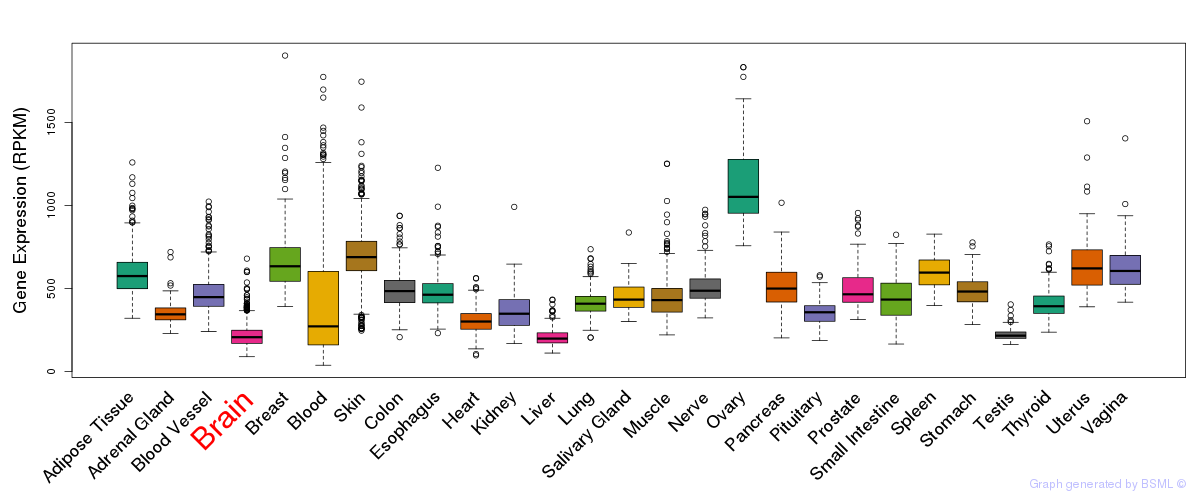
General gene expression (GTEx)
Gene expression during devlopment (BrainCloud)
Footnote:
A total of 269 time points ploted, with n=38 fetal samples (x=1:38). Each triangle represents one time point.
Gene expression of temporal and spatial changes (BrainSpan)
Footnote:
SC: sub-cortical regions; SM: sensory-motor regions; FC: frontal cortex; and TP: temporal-parietal cortex
ST1: fetal (13 - 26 postconception weeks), ST2: early infancy to late childhood (4 months to 11 years), and ST3: adolescence to adulthood (13 - 23 years)
The bar shown representes the lower 25% and upper 25% of the expression distribution.
Top co-expressed genes in brain regions
| Top 10 positively co-expressed genes | ||
| Gene | Pearson's Correlation | Spearman's Correlation |
| WDR76 | 0.95 | 0.91 |
| TRIP13 | 0.95 | 0.89 |
| MCM4 | 0.95 | 0.95 |
| NUP107 | 0.95 | 0.93 |
| NUP205 | 0.95 | 0.96 |
| MSH6 | 0.95 | 0.97 |
| TMPO | 0.94 | 0.93 |
| WDHD1 | 0.94 | 0.91 |
| PPM1D | 0.94 | 0.93 |
| MCM6 | 0.94 | 0.94 |
| Top 10 negatively co-expressed genes | ||
| Gene | Pearson's Correlation | Spearman's Correlation |
| HLA-F | -0.66 | -0.81 |
| AF347015.31 | -0.65 | -0.89 |
| AF347015.27 | -0.65 | -0.88 |
| MT-CO2 | -0.65 | -0.90 |
| AF347015.33 | -0.65 | -0.89 |
| AIFM3 | -0.64 | -0.79 |
| C5orf53 | -0.64 | -0.73 |
| FXYD1 | -0.64 | -0.89 |
| IFI27 | -0.64 | -0.89 |
| MT-CYB | -0.63 | -0.87 |
Section V. Pathway annotation
| Pathway name | Pathway size | # SZGR 2.0 genes in pathway | Info |
|---|---|---|---|
| KEGG RIBOSOME | 88 | 43 | All SZGR 2.0 genes in this pathway |
| REACTOME TRANSLATION | 222 | 75 | All SZGR 2.0 genes in this pathway |
| REACTOME FORMATION OF THE TERNARY COMPLEX AND SUBSEQUENTLY THE 43S COMPLEX | 74 | 24 | All SZGR 2.0 genes in this pathway |
| REACTOME SRP DEPENDENT COTRANSLATIONAL PROTEIN TARGETING TO MEMBRANE | 179 | 53 | All SZGR 2.0 genes in this pathway |
| REACTOME ACTIVATION OF THE MRNA UPON BINDING OF THE CAP BINDING COMPLEX AND EIFS AND SUBSEQUENT BINDING TO 43S | 84 | 30 | All SZGR 2.0 genes in this pathway |
| REACTOME PEPTIDE CHAIN ELONGATION | 153 | 41 | All SZGR 2.0 genes in this pathway |
| REACTOME METABOLISM OF PROTEINS | 518 | 242 | All SZGR 2.0 genes in this pathway |
| REACTOME 3 UTR MEDIATED TRANSLATIONAL REGULATION | 176 | 51 | All SZGR 2.0 genes in this pathway |
| REACTOME METABOLISM OF MRNA | 284 | 128 | All SZGR 2.0 genes in this pathway |
| REACTOME METABOLISM OF RNA | 330 | 155 | All SZGR 2.0 genes in this pathway |
| REACTOME INFLUENZA LIFE CYCLE | 203 | 72 | All SZGR 2.0 genes in this pathway |
| REACTOME INFLUENZA VIRAL RNA TRANSCRIPTION AND REPLICATION | 169 | 47 | All SZGR 2.0 genes in this pathway |
| REACTOME NONSENSE MEDIATED DECAY ENHANCED BY THE EXON JUNCTION COMPLEX | 176 | 57 | All SZGR 2.0 genes in this pathway |
| WATANABE RECTAL CANCER RADIOTHERAPY RESPONSIVE UP | 108 | 67 | All SZGR 2.0 genes in this pathway |
| OSMAN BLADDER CANCER DN | 406 | 230 | All SZGR 2.0 genes in this pathway |
| NUYTTEN EZH2 TARGETS DN | 1024 | 594 | All SZGR 2.0 genes in this pathway |
| BENPORATH NANOG TARGETS | 988 | 594 | All SZGR 2.0 genes in this pathway |
| BENPORATH MYC MAX TARGETS | 775 | 494 | All SZGR 2.0 genes in this pathway |
| HEDENFALK BREAST CANCER BRACX UP | 20 | 14 | All SZGR 2.0 genes in this pathway |
| SANSOM APC TARGETS REQUIRE MYC | 210 | 123 | All SZGR 2.0 genes in this pathway |
| ACEVEDO LIVER TUMOR VS NORMAL ADJACENT TISSUE UP | 863 | 514 | All SZGR 2.0 genes in this pathway |
| GRADE COLON CANCER UP | 871 | 505 | All SZGR 2.0 genes in this pathway |
| CHNG MULTIPLE MYELOMA HYPERPLOID UP | 52 | 25 | All SZGR 2.0 genes in this pathway |
| NUTT GBM VS AO GLIOMA DN | 45 | 22 | All SZGR 2.0 genes in this pathway |
| JISON SICKLE CELL DISEASE DN | 181 | 97 | All SZGR 2.0 genes in this pathway |
| YAGI AML WITH INV 16 TRANSLOCATION | 422 | 277 | All SZGR 2.0 genes in this pathway |
| DANG MYC TARGETS UP | 143 | 100 | All SZGR 2.0 genes in this pathway |
| DANG BOUND BY MYC | 1103 | 714 | All SZGR 2.0 genes in this pathway |
| KIM BIPOLAR DISORDER OLIGODENDROCYTE DENSITY CORR UP | 682 | 440 | All SZGR 2.0 genes in this pathway |
| BILANGES SERUM AND RAPAMYCIN SENSITIVE GENES | 68 | 35 | All SZGR 2.0 genes in this pathway |
| PECE MAMMARY STEM CELL UP | 146 | 75 | All SZGR 2.0 genes in this pathway |