Gene Page: SAA2
Summary ?
| GeneID | 6289 |
| Symbol | SAA2 |
| Synonyms | - |
| Description | serum amyloid A2 |
| Reference | MIM:104751|HGNC:HGNC:10514|Ensembl:ENSG00000134339|HPRD:00098|Vega:OTTHUMG00000166484 |
| Gene type | protein-coding |
| Map location | 11p15.1-p14 |
| Pascal p-value | 0.047 |
| Fetal beta | -0.108 |
Gene in Data Sources
| Gene set name | Method of gene set | Description | Info |
|---|---|---|---|
| CV:GWAScat | Genome-wide Association Studies | This data set includes 560 SNPs associated with schizophrenia. A total of 486 genes were mapped to these SNPs within 50kb. | |
| CV:GWASdb | Genome-wide Association Studies | GWASdb records for schizophrenia | |
| CV:PGCnp | Genome-wide Association Study | GWAS |
Section I. Genetics and epigenetics annotation
Section II. Transcriptome annotation
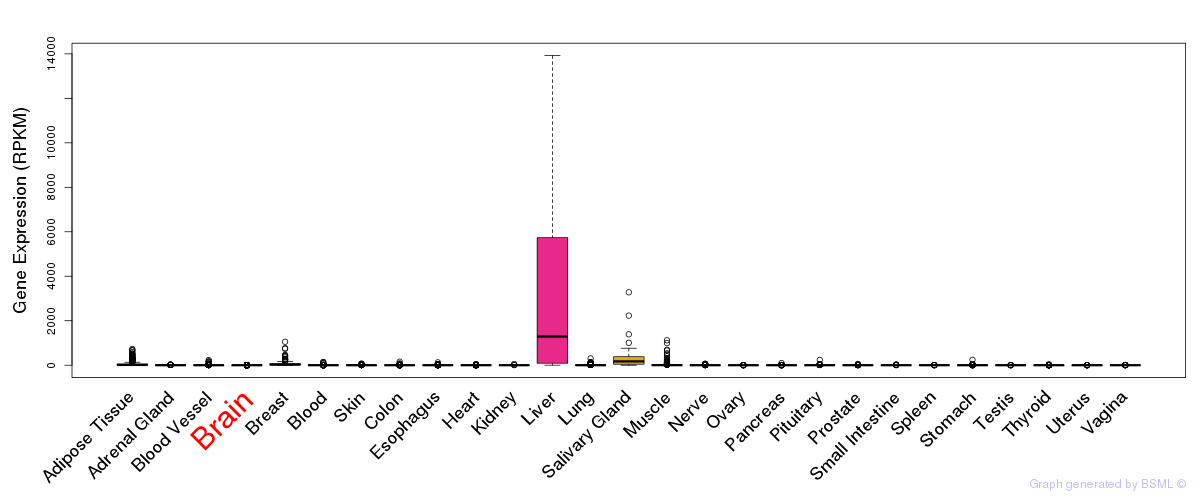
General gene expression (GTEx)
Gene expression during devlopment (BrainCloud)
Footnote:
A total of 269 time points ploted, with n=38 fetal samples (x=1:38). Each triangle represents one time point.
Gene expression of temporal and spatial changes (BrainSpan)
Footnote:
SC: sub-cortical regions; SM: sensory-motor regions; FC: frontal cortex; and TP: temporal-parietal cortex
ST1: fetal (13 - 26 postconception weeks), ST2: early infancy to late childhood (4 months to 11 years), and ST3: adolescence to adulthood (13 - 23 years)
The bar shown representes the lower 25% and upper 25% of the expression distribution.
Top co-expressed genes in brain regions
| Top 10 positively co-expressed genes | ||
| Gene | Pearson's Correlation | Spearman's Correlation |
| VAMP1 | 0.94 | 0.87 |
| STAC2 | 0.89 | 0.70 |
| AGPAT9 | 0.84 | 0.85 |
| ARHGAP9 | 0.83 | 0.81 |
| HAPLN4 | 0.83 | 0.45 |
| KCNC1 | 0.82 | 0.35 |
| AC011676.2 | 0.82 | 0.68 |
| EIF4E1B | 0.81 | 0.71 |
| P2RX6 | 0.79 | 0.85 |
| MPP1 | 0.79 | 0.57 |
| Top 10 negatively co-expressed genes | ||
| Gene | Pearson's Correlation | Spearman's Correlation |
| FADS2 | -0.41 | -0.67 |
| WDR86 | -0.41 | -0.48 |
| BCL7C | -0.40 | -0.71 |
| OLFM2 | -0.38 | -0.50 |
| TUBB2B | -0.38 | -0.80 |
| GTF3C6 | -0.38 | -0.61 |
| PKN1 | -0.38 | -0.71 |
| KIAA1949 | -0.38 | -0.73 |
| SH3BP2 | -0.37 | -0.73 |
| TRAF4 | -0.37 | -0.76 |
Section V. Pathway annotation
| Pathway name | Pathway size | # SZGR 2.0 genes in pathway | Info |
|---|---|---|---|
| WONG ENDMETRIUM CANCER UP | 25 | 17 | All SZGR 2.0 genes in this pathway |
| SARRIO EPITHELIAL MESENCHYMAL TRANSITION DN | 154 | 101 | All SZGR 2.0 genes in this pathway |
| FEVR CTNNB1 TARGETS UP | 682 | 433 | All SZGR 2.0 genes in this pathway |
| KRIEG KDM3A TARGETS NOT HYPOXIA | 208 | 107 | All SZGR 2.0 genes in this pathway |
| GUILLAUMOND KLF10 TARGETS UP | 51 | 39 | All SZGR 2.0 genes in this pathway |
| ZWANG TRANSIENTLY UP BY 1ST EGF PULSE ONLY | 1839 | 928 | All SZGR 2.0 genes in this pathway |