Gene Page: PKNOX2
Summary ?
| GeneID | 63876 |
| Symbol | PKNOX2 |
| Synonyms | PREP2 |
| Description | PBX/knotted 1 homeobox 2 |
| Reference | MIM:613066|HGNC:HGNC:16714|Ensembl:ENSG00000165495|HPRD:17857|Vega:OTTHUMG00000165884 |
| Gene type | protein-coding |
| Map location | 11q24.2 |
| Pascal p-value | 0.075 |
| Sherlock p-value | 0.666 |
| Fetal beta | -0.982 |
| DMG | 1 (# studies) |
| eGene | Caudate basal ganglia Hypothalamus Putamen basal ganglia |
Gene in Data Sources
| Gene set name | Method of gene set | Description | Info |
|---|---|---|---|
| CV:GWAScat | Genome-wide Association Studies | This data set includes 560 SNPs associated with schizophrenia. A total of 486 genes were mapped to these SNPs within 50kb. | |
| CV:GWASdb | Genome-wide Association Studies | GWASdb records for schizophrenia | |
| CV:PGCnp | Genome-wide Association Study | GWAS | |
| DMG:Wockner_2014 | Genome-wide DNA methylation analysis | This dataset includes 4641 differentially methylated probes corresponding to 2929 unique genes between schizophrenia patients (n=24) and controls (n=24). | 1 |
| PMID:cooccur | High-throughput literature-search | Systematic search in PubMed for genes co-occurring with SCZ keywords. A total of 3027 genes were included. | |
| Literature | High-throughput literature-search | Co-occurance with Schizophrenia keywords: schizophrenia,schizophrenias | Click to show details |
Section I. Genetics and epigenetics annotation
 Differentially methylated gene
| Probe | Chromosome | Position | Nearest gene | P (dis) | Beta (dis) | FDR (dis) | Study |
|---|---|---|---|---|---|---|---|
| cg13157483 | 11 | 125145672 | PKNOX2 | 8.81E-6 | 0.461 | 0.013 | DMG:Wockner_2014 |
eQTL annotation
| SNP ID | Chromosome | Position | eGene | Gene Entrez ID | pvalue | qvalue | TSS distance | eQTL type |
|---|---|---|---|---|---|---|---|---|
| rs34332033 | 11 | 125110166 | PKNOX2 | ENSG00000165495.11 | 2.21012E-6 | 0.03 | 75583 | gtex_brain_putamen_basal |
Section II. Transcriptome annotation
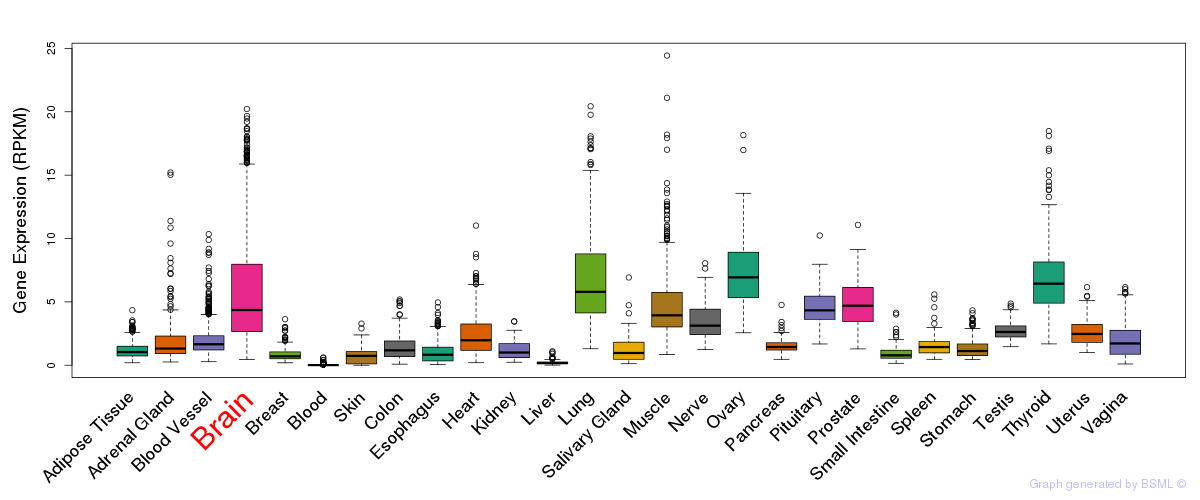
General gene expression (GTEx)
Gene expression during devlopment (BrainCloud)
Footnote:
A total of 269 time points ploted, with n=38 fetal samples (x=1:38). Each triangle represents one time point.
Gene expression of temporal and spatial changes (BrainSpan)
Footnote:
SC: sub-cortical regions; SM: sensory-motor regions; FC: frontal cortex; and TP: temporal-parietal cortex
ST1: fetal (13 - 26 postconception weeks), ST2: early infancy to late childhood (4 months to 11 years), and ST3: adolescence to adulthood (13 - 23 years)
The bar shown representes the lower 25% and upper 25% of the expression distribution.
No co-expressed genes in brain regions
Section V. Pathway annotation
| Pathway name | Pathway size | # SZGR 2.0 genes in pathway | Info |
|---|---|---|---|
| BENPORATH SUZ12 TARGETS | 1038 | 678 | All SZGR 2.0 genes in this pathway |
| BENPORATH EED TARGETS | 1062 | 725 | All SZGR 2.0 genes in this pathway |
| BENPORATH ES WITH H3K27ME3 | 1118 | 744 | All SZGR 2.0 genes in this pathway |
| BENPORATH PRC2 TARGETS | 652 | 441 | All SZGR 2.0 genes in this pathway |
| MOREAUX MULTIPLE MYELOMA BY TACI UP | 412 | 249 | All SZGR 2.0 genes in this pathway |
| BLALOCK ALZHEIMERS DISEASE DN | 1237 | 837 | All SZGR 2.0 genes in this pathway |
| LIM MAMMARY STEM CELL UP | 489 | 314 | All SZGR 2.0 genes in this pathway |