Gene Page: RNF123
Summary ?
| GeneID | 63891 |
| Symbol | RNF123 |
| Synonyms | FP1477|KPC1 |
| Description | ring finger protein 123 |
| Reference | MIM:614472|HGNC:HGNC:21148|Ensembl:ENSG00000164068|HPRD:11499|Vega:OTTHUMG00000156891 |
| Gene type | protein-coding |
| Map location | 3p24.3 |
| Pascal p-value | 0.028 |
| Sherlock p-value | 0.29 |
| Fetal beta | 0.429 |
| DMG | 1 (# studies) |
| eGene | Caudate basal ganglia Cerebellar Hemisphere Cerebellum Cortex Frontal Cortex BA9 Putamen basal ganglia |
Gene in Data Sources
| Gene set name | Method of gene set | Description | Info |
|---|---|---|---|
| CV:PGCnp | Genome-wide Association Study | GWAS | |
| DMG:Jaffe_2016 | Genome-wide DNA methylation analysis | This dataset includes 2,104 probes/CpGs associated with SZ patients (n=108) compared to 136 controls at Bonferroni-adjusted P < 0.05. | 1 |
Section I. Genetics and epigenetics annotation
 Differentially methylated gene
| Probe | Chromosome | Position | Nearest gene | P (dis) | Beta (dis) | FDR (dis) | Study |
|---|---|---|---|---|---|---|---|
| cg24758019 | 3 | 49726922 | RNF123 | 1.48E-11 | -0.014 | 2.86E-7 | DMG:Jaffe_2016 |
eQTL annotation
| SNP ID | Chromosome | Position | eGene | Gene Entrez ID | pvalue | qvalue | TSS distance | eQTL type |
|---|---|---|---|---|---|---|---|---|
| rs3749241 | 3 | 49744392 | RNF123 | ENSG00000164068.11 | 7.029E-6 | 0.01 | 15829 | gtex_brain_putamen_basal |
| rs3749240 | 3 | 49750188 | RNF123 | ENSG00000164068.11 | 7.029E-6 | 0.01 | 21625 | gtex_brain_putamen_basal |
| rs138638683 | 3 | 49757592 | RNF123 | ENSG00000164068.11 | 1.099E-5 | 0.01 | 29029 | gtex_brain_putamen_basal |
| rs7634902 | 3 | 49762662 | RNF123 | ENSG00000164068.11 | 7.019E-6 | 0.01 | 34099 | gtex_brain_putamen_basal |
| rs1049256 | 3 | 49763338 | RNF123 | ENSG00000164068.11 | 7.019E-6 | 0.01 | 34775 | gtex_brain_putamen_basal |
| rs7649348 | 3 | 49772375 | RNF123 | ENSG00000164068.11 | 7.019E-6 | 0.01 | 43812 | gtex_brain_putamen_basal |
| rs7618501 | 3 | 49772647 | RNF123 | ENSG00000164068.11 | 7.019E-6 | 0.01 | 44084 | gtex_brain_putamen_basal |
| rs7618519 | 3 | 49772708 | RNF123 | ENSG00000164068.11 | 7.019E-6 | 0.01 | 44145 | gtex_brain_putamen_basal |
| rs9876508 | 3 | 49780844 | RNF123 | ENSG00000164068.11 | 7.019E-6 | 0.01 | 52281 | gtex_brain_putamen_basal |
| rs9853458 | 3 | 49783211 | RNF123 | ENSG00000164068.11 | 7.019E-6 | 0.01 | 54648 | gtex_brain_putamen_basal |
| rs7374277 | 3 | 49784777 | RNF123 | ENSG00000164068.11 | 7.019E-6 | 0.01 | 56214 | gtex_brain_putamen_basal |
| rs7372730 | 3 | 49790682 | RNF123 | ENSG00000164068.11 | 7.019E-6 | 0.01 | 62119 | gtex_brain_putamen_basal |
| rs9855505 | 3 | 49792158 | RNF123 | ENSG00000164068.11 | 7.019E-6 | 0.01 | 63595 | gtex_brain_putamen_basal |
| rs12490656 | 3 | 49798520 | RNF123 | ENSG00000164068.11 | 7.83E-7 | 0.01 | 69957 | gtex_brain_putamen_basal |
| rs7634886 | 3 | 49798920 | RNF123 | ENSG00000164068.11 | 4.743E-6 | 0.01 | 70357 | gtex_brain_putamen_basal |
| rs6446295 | 3 | 49809063 | RNF123 | ENSG00000164068.11 | 7.019E-6 | 0.01 | 80500 | gtex_brain_putamen_basal |
| rs6766836 | 3 | 49810961 | RNF123 | ENSG00000164068.11 | 1.345E-5 | 0.01 | 82398 | gtex_brain_putamen_basal |
| rs34451146 | 3 | 49813013 | RNF123 | ENSG00000164068.11 | 7.019E-6 | 0.01 | 84450 | gtex_brain_putamen_basal |
| rs9814765 | 3 | 49818555 | RNF123 | ENSG00000164068.11 | 1.451E-5 | 0.01 | 89992 | gtex_brain_putamen_basal |
| rs11130221 | 3 | 49819102 | RNF123 | ENSG00000164068.11 | 7.019E-6 | 0.01 | 90539 | gtex_brain_putamen_basal |
| rs9871654 | 3 | 49825370 | RNF123 | ENSG00000164068.11 | 6.974E-6 | 0.01 | 96807 | gtex_brain_putamen_basal |
| rs2234391 | 3 | 49842625 | RNF123 | ENSG00000164068.11 | 7.019E-6 | 0.01 | 114062 | gtex_brain_putamen_basal |
| rs7648987 | 3 | 49868455 | RNF123 | ENSG00000164068.11 | 8.865E-6 | 0.01 | 139892 | gtex_brain_putamen_basal |
| rs200696249 | 3 | 49869923 | RNF123 | ENSG00000164068.11 | 3.336E-6 | 0.01 | 141360 | gtex_brain_putamen_basal |
Section II. Transcriptome annotation
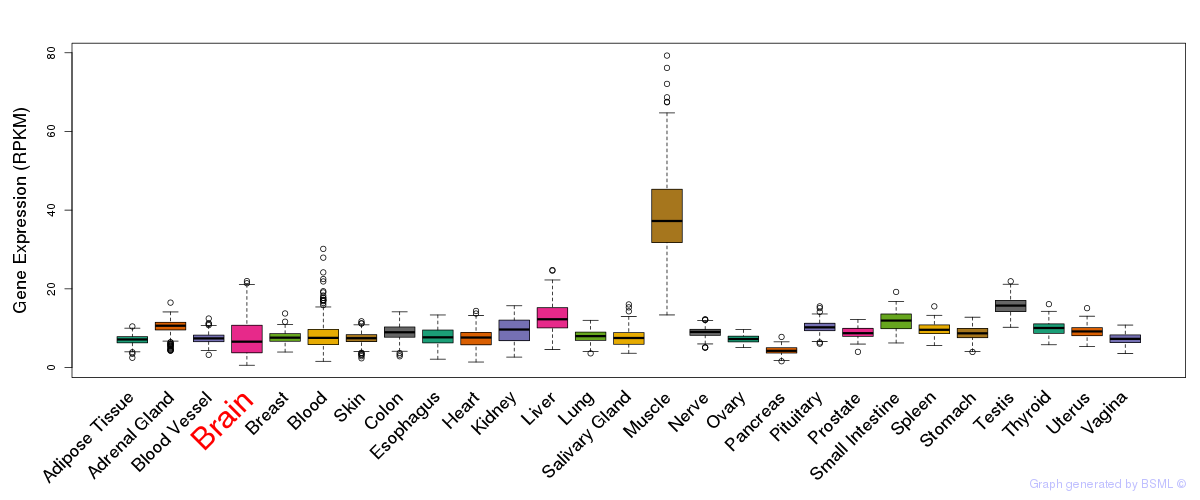
General gene expression (GTEx)
Gene expression during devlopment (BrainCloud)
Footnote:
A total of 269 time points ploted, with n=38 fetal samples (x=1:38). Each triangle represents one time point.
Gene expression of temporal and spatial changes (BrainSpan)
Footnote:
SC: sub-cortical regions; SM: sensory-motor regions; FC: frontal cortex; and TP: temporal-parietal cortex
ST1: fetal (13 - 26 postconception weeks), ST2: early infancy to late childhood (4 months to 11 years), and ST3: adolescence to adulthood (13 - 23 years)
The bar shown representes the lower 25% and upper 25% of the expression distribution.
No co-expressed genes in brain regions
Section V. Pathway annotation
| Pathway name | Pathway size | # SZGR 2.0 genes in pathway | Info |
|---|---|---|---|
| REACTOME IMMUNE SYSTEM | 933 | 616 | All SZGR 2.0 genes in this pathway |
| REACTOME ADAPTIVE IMMUNE SYSTEM | 539 | 350 | All SZGR 2.0 genes in this pathway |
| REACTOME CLASS I MHC MEDIATED ANTIGEN PROCESSING PRESENTATION | 251 | 156 | All SZGR 2.0 genes in this pathway |
| REACTOME ANTIGEN PROCESSING UBIQUITINATION PROTEASOME DEGRADATION | 212 | 129 | All SZGR 2.0 genes in this pathway |
| PARENT MTOR SIGNALING UP | 567 | 375 | All SZGR 2.0 genes in this pathway |
| VECCHI GASTRIC CANCER EARLY UP | 430 | 232 | All SZGR 2.0 genes in this pathway |
| GOTTWEIN TARGETS OF KSHV MIR K12 11 | 63 | 45 | All SZGR 2.0 genes in this pathway |
| IWANAGA CARCINOGENESIS BY KRAS UP | 170 | 107 | All SZGR 2.0 genes in this pathway |
| MIKKELSEN MCV6 LCP WITH H3K4ME3 | 162 | 80 | All SZGR 2.0 genes in this pathway |
| MIKKELSEN MEF LCP WITH H3K4ME3 | 128 | 68 | All SZGR 2.0 genes in this pathway |