Gene Page: SETMAR
Summary ?
| GeneID | 6419 |
| Symbol | SETMAR |
| Synonyms | METNASE|Mar1 |
| Description | SET domain and mariner transposase fusion gene |
| Reference | MIM:609834|HGNC:HGNC:10762|Ensembl:ENSG00000170364|HPRD:10225|Vega:OTTHUMG00000090265 |
| Gene type | protein-coding |
| Map location | 3p26.1 |
| Pascal p-value | 0.091 |
| Sherlock p-value | 0.168 |
| Fetal beta | 1.237 |
| DMG | 1 (# studies) |
| eGene | Meta |
| Support | Chromatin Remodeling Genes |
Gene in Data Sources
| Gene set name | Method of gene set | Description | Info |
|---|---|---|---|
| CV:PGCnp | Genome-wide Association Study | GWAS | |
| DMG:Wockner_2014 | Genome-wide DNA methylation analysis | This dataset includes 4641 differentially methylated probes corresponding to 2929 unique genes between schizophrenia patients (n=24) and controls (n=24). | 1 |
Section I. Genetics and epigenetics annotation
 Differentially methylated gene
| Probe | Chromosome | Position | Nearest gene | P (dis) | Beta (dis) | FDR (dis) | Study |
|---|---|---|---|---|---|---|---|
| cg00300090 | 3 | 4345167 | SETMAR | 8.4E-5 | -0.366 | 0.026 | DMG:Wockner_2014 |
Section II. Transcriptome annotation
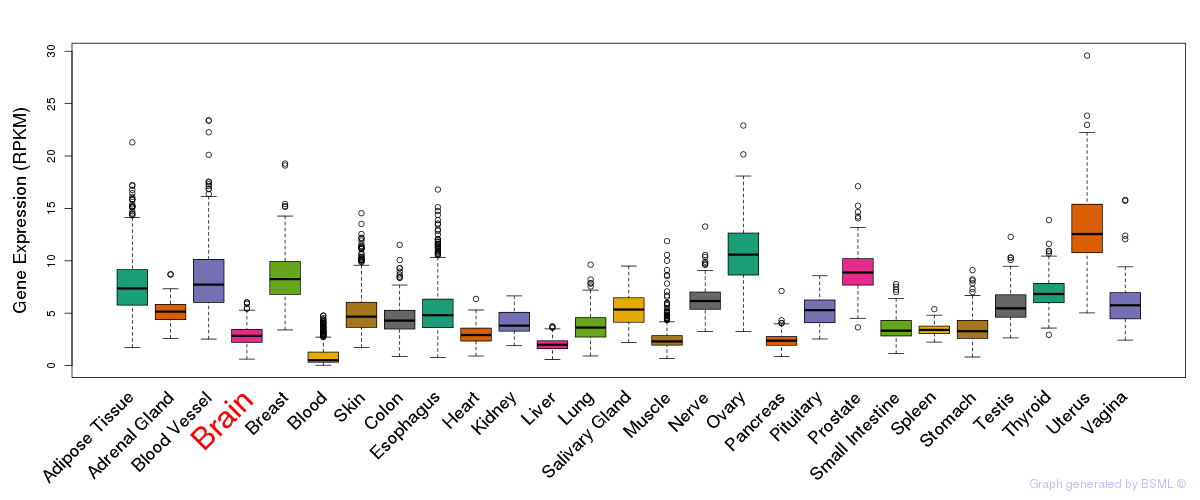
General gene expression (GTEx)
Gene expression during devlopment (BrainCloud)
Footnote:
A total of 269 time points ploted, with n=38 fetal samples (x=1:38). Each triangle represents one time point.
Gene expression of temporal and spatial changes (BrainSpan)
Footnote:
SC: sub-cortical regions; SM: sensory-motor regions; FC: frontal cortex; and TP: temporal-parietal cortex
ST1: fetal (13 - 26 postconception weeks), ST2: early infancy to late childhood (4 months to 11 years), and ST3: adolescence to adulthood (13 - 23 years)
The bar shown representes the lower 25% and upper 25% of the expression distribution.
Top co-expressed genes in brain regions
| Top 10 positively co-expressed genes | ||
| Gene | Pearson's Correlation | Spearman's Correlation |
| ZNF282 | 0.94 | 0.94 |
| TRIM46 | 0.93 | 0.94 |
| STRN4 | 0.93 | 0.95 |
| RNF40 | 0.93 | 0.92 |
| ZNF777 | 0.92 | 0.92 |
| RAB35 | 0.92 | 0.92 |
| RAB11B | 0.92 | 0.92 |
| AKT1 | 0.92 | 0.92 |
| U2AF2 | 0.92 | 0.92 |
| TTLL12 | 0.92 | 0.92 |
| Top 10 negatively co-expressed genes | ||
| Gene | Pearson's Correlation | Spearman's Correlation |
| AF347015.31 | -0.79 | -0.88 |
| AF347015.27 | -0.78 | -0.88 |
| MT-CO2 | -0.77 | -0.87 |
| AF347015.33 | -0.77 | -0.86 |
| MT-CYB | -0.76 | -0.87 |
| AF347015.8 | -0.74 | -0.86 |
| S100B | -0.72 | -0.81 |
| C5orf53 | -0.72 | -0.74 |
| AF347015.15 | -0.72 | -0.85 |
| HLA-F | -0.70 | -0.72 |
Section V. Pathway annotation
| Pathway name | Pathway size | # SZGR 2.0 genes in pathway | Info |
|---|---|---|---|
| KEGG LYSINE DEGRADATION | 44 | 29 | All SZGR 2.0 genes in this pathway |
| HOLLMANN APOPTOSIS VIA CD40 DN | 267 | 178 | All SZGR 2.0 genes in this pathway |
| ODONNELL TFRC TARGETS DN | 139 | 76 | All SZGR 2.0 genes in this pathway |
| DODD NASOPHARYNGEAL CARCINOMA DN | 1375 | 806 | All SZGR 2.0 genes in this pathway |
| LASTOWSKA NEUROBLASTOMA COPY NUMBER DN | 800 | 473 | All SZGR 2.0 genes in this pathway |
| FARMER BREAST CANCER APOCRINE VS LUMINAL | 326 | 213 | All SZGR 2.0 genes in this pathway |
| BUYTAERT PHOTODYNAMIC THERAPY STRESS DN | 637 | 377 | All SZGR 2.0 genes in this pathway |
| ONDER CDH1 TARGETS 1 DN | 169 | 102 | All SZGR 2.0 genes in this pathway |
| STEIN ESRRA TARGETS UP | 388 | 234 | All SZGR 2.0 genes in this pathway |
| BLUM RESPONSE TO SALIRASIB DN | 342 | 220 | All SZGR 2.0 genes in this pathway |
| STEIN ESRRA TARGETS | 535 | 325 | All SZGR 2.0 genes in this pathway |
| MARTENS TRETINOIN RESPONSE DN | 841 | 431 | All SZGR 2.0 genes in this pathway |
| GREGORY SYNTHETIC LETHAL WITH IMATINIB | 145 | 83 | All SZGR 2.0 genes in this pathway |