Gene Page: EPS8L2
Summary ?
| GeneID | 64787 |
| Symbol | EPS8L2 |
| Synonyms | EPS8R2 |
| Description | EPS8 like 2 |
| Reference | MIM:614988|HGNC:HGNC:21296|Ensembl:ENSG00000177106|HPRD:10940|Vega:OTTHUMG00000165165 |
| Gene type | protein-coding |
| Map location | 11p15.5 |
| Pascal p-value | 0.574 |
| Sherlock p-value | 0.19 |
| Fetal beta | -0.875 |
| DMG | 1 (# studies) |
| eGene | Caudate basal ganglia Cerebellar Hemisphere Cerebellum Putamen basal ganglia Myers' cis & trans Meta |
Gene in Data Sources
| Gene set name | Method of gene set | Description | Info |
|---|---|---|---|
| CV:PGCnp | Genome-wide Association Study | GWAS | |
| DMG:Wockner_2014 | Genome-wide DNA methylation analysis | This dataset includes 4641 differentially methylated probes corresponding to 2929 unique genes between schizophrenia patients (n=24) and controls (n=24). | 1 |
Section I. Genetics and epigenetics annotation
 Differentially methylated gene
| Probe | Chromosome | Position | Nearest gene | P (dis) | Beta (dis) | FDR (dis) | Study |
|---|---|---|---|---|---|---|---|
| cg04587886 | 11 | 719633 | EPS8L2 | 4.78E-5 | 0.428 | 0.021 | DMG:Wockner_2014 |
eQTL annotation
| SNP ID | Chromosome | Position | eGene | Gene Entrez ID | pvalue | qvalue | TSS distance | eQTL type |
|---|---|---|---|---|---|---|---|---|
| rs17392743 | chr1 | 54764240 | EPS8L2 | 64787 | 0.17 | trans | ||
| rs4655567 | chr1 | 68101639 | EPS8L2 | 64787 | 0.2 | trans | ||
| rs1170050 | chr1 | 116004969 | EPS8L2 | 64787 | 0.15 | trans | ||
| rs6687849 | chr1 | 175904808 | EPS8L2 | 64787 | 1.572E-4 | trans | ||
| rs2481653 | chr1 | 176044120 | EPS8L2 | 64787 | 0.07 | trans | ||
| rs2502827 | chr1 | 176044216 | EPS8L2 | 64787 | 1.057E-6 | trans | ||
| rs12405921 | chr1 | 206695730 | EPS8L2 | 64787 | 0.17 | trans | ||
| rs17572651 | chr1 | 218943612 | EPS8L2 | 64787 | 0.08 | trans | ||
| rs882011 | chr2 | 22711668 | EPS8L2 | 64787 | 0.01 | trans | ||
| rs16829545 | chr2 | 151977407 | EPS8L2 | 64787 | 9.945E-4 | trans | ||
| rs16841750 | chr2 | 158288461 | EPS8L2 | 64787 | 0.07 | trans | ||
| rs3845734 | chr2 | 171125572 | EPS8L2 | 64787 | 0.15 | trans | ||
| rs7584986 | chr2 | 184111432 | EPS8L2 | 64787 | 0 | trans | ||
| rs2322831 | chr3 | 4799093 | EPS8L2 | 64787 | 0.15 | trans | ||
| rs6807632 | chr3 | 111395567 | EPS8L2 | 64787 | 0.01 | trans | ||
| rs10013482 | chr4 | 82552047 | EPS8L2 | 64787 | 0.11 | trans | ||
| rs17762315 | chr5 | 76807576 | EPS8L2 | 64787 | 0.16 | trans | ||
| rs7729096 | chr5 | 76835927 | EPS8L2 | 64787 | 0.12 | trans | ||
| rs1368303 | chr5 | 147672388 | EPS8L2 | 64787 | 2.324E-6 | trans | ||
| rs3779491 | chr7 | 95120635 | EPS8L2 | 64787 | 0.03 | trans | ||
| rs6989594 | chr8 | 126303866 | EPS8L2 | 64787 | 3.644E-4 | trans | ||
| rs17263352 | chr9 | 124811572 | EPS8L2 | 64787 | 0.01 | trans | ||
| rs17036489 | chr12 | 105292283 | EPS8L2 | 64787 | 0.18 | trans | ||
| rs457696 | chr13 | 32581313 | EPS8L2 | 64787 | 0.02 | trans | ||
| rs1629937 | chr14 | 77059671 | EPS8L2 | 64787 | 0.09 | trans | ||
| rs17104720 | chr14 | 77127308 | EPS8L2 | 64787 | 3.661E-5 | trans | ||
| rs6574467 | chr14 | 79179744 | EPS8L2 | 64787 | 0.01 | trans | ||
| rs10146003 | chr14 | 79191170 | EPS8L2 | 64787 | 0.01 | trans | ||
| rs16955618 | chr15 | 29937543 | EPS8L2 | 64787 | 6.504E-17 | trans | ||
| snp_a-1830894 | 0 | EPS8L2 | 64787 | 0 | trans | |||
| rs1420984 | chr16 | 51408733 | EPS8L2 | 64787 | 0.18 | trans | ||
| rs16968252 | chr17 | 31692447 | EPS8L2 | 64787 | 0 | trans | ||
| rs17823633 | chr17 | 68851458 | EPS8L2 | 64787 | 0 | trans | ||
| rs17085767 | chr18 | 69839397 | EPS8L2 | 64787 | 0.1 | trans | ||
| rs5955025 | chrX | 142542997 | EPS8L2 | 64787 | 0.07 | trans | ||
| rs7928943 | 11 | 698253 | EPS8L2 | ENSG00000177106.10 | 4.164E-7 | 0.01 | 3815 | gtex_brain_putamen_basal |
| rs11246269 | 11 | 698626 | EPS8L2 | ENSG00000177106.10 | 3.592E-7 | 0.01 | 4188 | gtex_brain_putamen_basal |
| rs7107522 | 11 | 703175 | EPS8L2 | ENSG00000177106.10 | 3.295E-7 | 0.01 | 8737 | gtex_brain_putamen_basal |
| rs11246277 | 11 | 706310 | EPS8L2 | ENSG00000177106.10 | 4.559E-7 | 0.01 | 11872 | gtex_brain_putamen_basal |
| rs11246278 | 11 | 706510 | EPS8L2 | ENSG00000177106.10 | 2.318E-7 | 0.01 | 12072 | gtex_brain_putamen_basal |
| rs73407148 | 11 | 707152 | EPS8L2 | ENSG00000177106.10 | 7.014E-7 | 0.01 | 12714 | gtex_brain_putamen_basal |
| rs10902203 | 11 | 711149 | EPS8L2 | ENSG00000177106.10 | 1.387E-6 | 0.01 | 16711 | gtex_brain_putamen_basal |
| rs11605373 | 11 | 711970 | EPS8L2 | ENSG00000177106.10 | 5.271E-7 | 0.01 | 17532 | gtex_brain_putamen_basal |
| rs113249763 | 11 | 712611 | EPS8L2 | ENSG00000177106.10 | 1.041E-6 | 0.01 | 18173 | gtex_brain_putamen_basal |
| rs11246286 | 11 | 715420 | EPS8L2 | ENSG00000177106.10 | 9.194E-7 | 0.01 | 20982 | gtex_brain_putamen_basal |
| rs28648977 | 11 | 772235 | EPS8L2 | ENSG00000177106.10 | 1.929E-6 | 0.01 | 77797 | gtex_brain_putamen_basal |
Section II. Transcriptome annotation
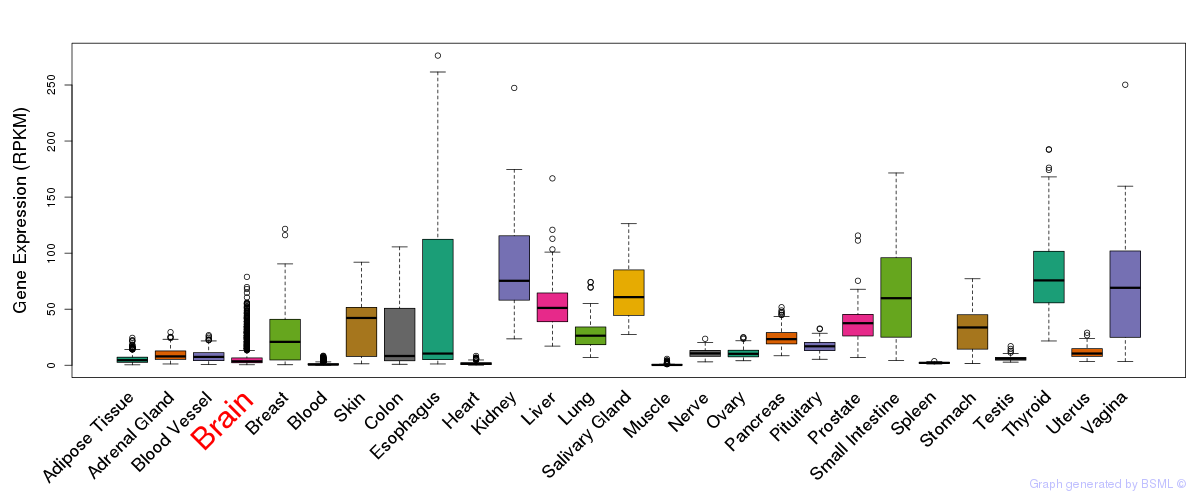
General gene expression (GTEx)
Gene expression during devlopment (BrainCloud)
Footnote:
A total of 269 time points ploted, with n=38 fetal samples (x=1:38). Each triangle represents one time point.
Gene expression of temporal and spatial changes (BrainSpan)
Footnote:
SC: sub-cortical regions; SM: sensory-motor regions; FC: frontal cortex; and TP: temporal-parietal cortex
ST1: fetal (13 - 26 postconception weeks), ST2: early infancy to late childhood (4 months to 11 years), and ST3: adolescence to adulthood (13 - 23 years)
The bar shown representes the lower 25% and upper 25% of the expression distribution.
No co-expressed genes in brain regions
Section V. Pathway annotation
| Pathway name | Pathway size | # SZGR 2.0 genes in pathway | Info |
|---|---|---|---|
| SENESE HDAC1 TARGETS DN | 260 | 143 | All SZGR 2.0 genes in this pathway |
| WAMUNYOKOLI OVARIAN CANCER LMP UP | 265 | 158 | All SZGR 2.0 genes in this pathway |
| DODD NASOPHARYNGEAL CARCINOMA UP | 1821 | 933 | All SZGR 2.0 genes in this pathway |
| COLDREN GEFITINIB RESISTANCE DN | 230 | 115 | All SZGR 2.0 genes in this pathway |
| KERLEY RESPONSE TO CISPLATIN UP | 44 | 30 | All SZGR 2.0 genes in this pathway |
| PEREZ TP53 TARGETS | 1174 | 695 | All SZGR 2.0 genes in this pathway |
| FERREIRA EWINGS SARCOMA UNSTABLE VS STABLE DN | 98 | 59 | All SZGR 2.0 genes in this pathway |
| ONDER CDH1 TARGETS 2 DN | 464 | 276 | All SZGR 2.0 genes in this pathway |
| CHUANG OXIDATIVE STRESS RESPONSE UP | 28 | 18 | All SZGR 2.0 genes in this pathway |
| CREIGHTON ENDOCRINE THERAPY RESISTANCE 3 | 720 | 440 | All SZGR 2.0 genes in this pathway |
| GRADE COLON CANCER UP | 871 | 505 | All SZGR 2.0 genes in this pathway |
| MEISSNER NPC HCP WITH H3 UNMETHYLATED | 536 | 296 | All SZGR 2.0 genes in this pathway |
| COULOUARN TEMPORAL TGFB1 SIGNATURE DN | 138 | 99 | All SZGR 2.0 genes in this pathway |
| ZEMBUTSU SENSITIVITY TO DOXORUBICIN | 17 | 10 | All SZGR 2.0 genes in this pathway |
| MARTENS TRETINOIN RESPONSE UP | 857 | 456 | All SZGR 2.0 genes in this pathway |
| BRUINS UVC RESPONSE LATE | 1137 | 655 | All SZGR 2.0 genes in this pathway |
| FEVR CTNNB1 TARGETS UP | 682 | 433 | All SZGR 2.0 genes in this pathway |
| DELACROIX RARG BOUND MEF | 367 | 231 | All SZGR 2.0 genes in this pathway |
| PECE MAMMARY STEM CELL UP | 146 | 75 | All SZGR 2.0 genes in this pathway |