Gene Page: SLC13A1
Summary ?
| GeneID | 6561 |
| Symbol | SLC13A1 |
| Synonyms | NAS1|NaSi-1 |
| Description | solute carrier family 13 member 1 |
| Reference | MIM:606193|HGNC:HGNC:10916|Ensembl:ENSG00000081800|HPRD:08394|Vega:OTTHUMG00000157087 |
| Gene type | protein-coding |
| Map location | 7q31.32 |
| Pascal p-value | 0.59 |
| eGene | Meta |
| Support | CompositeSet |
Gene in Data Sources
| Gene set name | Method of gene set | Description | Info |
|---|---|---|---|
| CV:PGCnp | Genome-wide Association Study | GWAS | |
| DNM:Fromer_2014 | Whole Exome Sequencing analysis | This study reported a WES study of 623 schizophrenia trios, reporting DNMs using genomic DNA. | |
| DNM:McCarthy_2014 | Whole Exome Sequencing analysis | Whole exome sequencing of 57 trios with sporadic or familial schizophrenia. |
Section I. Genetics and epigenetics annotation
 DNM table
| Gene | Chromosome | Position | Ref | Alt | Transcript | AA change | Mutation type | Sift | CG46 | Trait | Study |
|---|---|---|---|---|---|---|---|---|---|---|---|
| SLC13A1 | chr7 | 122765663 | A | G | NM_022444 | p.P400P | synonymous SNV | Schizophrenia | DNM:McCarthy_2014 | ||
| SLC13A1 | chr7 | 122787322 | C | T | NM_022444 | p.235V>M | missense | Schizophrenia | DNM:Fromer_2014 |
Section II. Transcriptome annotation
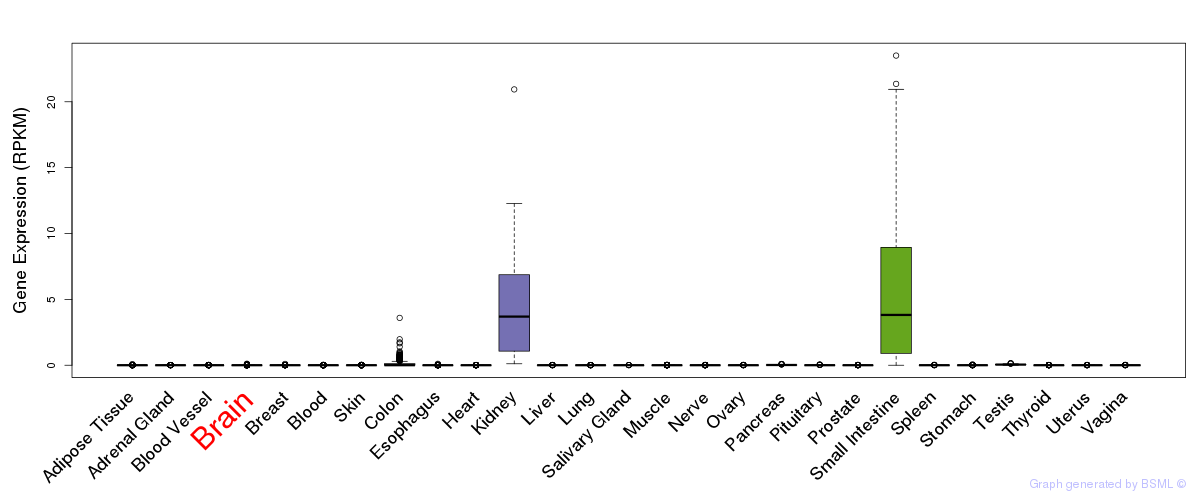
General gene expression (GTEx)
Gene expression of temporal and spatial changes (BrainSpan)
Footnote:
SC: sub-cortical regions; SM: sensory-motor regions; FC: frontal cortex; and TP: temporal-parietal cortex
ST1: fetal (13 - 26 postconception weeks), ST2: early infancy to late childhood (4 months to 11 years), and ST3: adolescence to adulthood (13 - 23 years)
The bar shown representes the lower 25% and upper 25% of the expression distribution.
Top co-expressed genes in brain regions
| Top 10 positively co-expressed genes | ||
| Gene | Pearson's Correlation | Spearman's Correlation |
| CPSF7 | 0.95 | 0.95 |
| SF3A1 | 0.95 | 0.95 |
| RNF214 | 0.95 | 0.95 |
| RPRD2 | 0.94 | 0.96 |
| SART3 | 0.94 | 0.95 |
| SF1 | 0.94 | 0.95 |
| DHX8 | 0.94 | 0.94 |
| DHX38 | 0.94 | 0.93 |
| LSM14B | 0.93 | 0.93 |
| RNASEN | 0.93 | 0.93 |
| Top 10 negatively co-expressed genes | ||
| Gene | Pearson's Correlation | Spearman's Correlation |
| AF347015.31 | -0.80 | -0.88 |
| MT-CO2 | -0.78 | -0.86 |
| HIGD1B | -0.77 | -0.86 |
| IFI27 | -0.77 | -0.84 |
| AF347015.21 | -0.75 | -0.90 |
| FXYD1 | -0.75 | -0.83 |
| MT-CYB | -0.74 | -0.82 |
| AF347015.27 | -0.74 | -0.83 |
| AF347015.33 | -0.73 | -0.80 |
| AF347015.8 | -0.73 | -0.83 |
Section V. Pathway annotation
| Pathway name | Pathway size | # SZGR 2.0 genes in pathway | Info |
|---|---|---|---|
| REACTOME TRANSMEMBRANE TRANSPORT OF SMALL MOLECULES | 413 | 270 | All SZGR 2.0 genes in this pathway |
| REACTOME SLC MEDIATED TRANSMEMBRANE TRANSPORT | 241 | 157 | All SZGR 2.0 genes in this pathway |
| REACTOME TRANSPORT OF GLUCOSE AND OTHER SUGARS BILE SALTS AND ORGANIC ACIDS METAL IONS AND AMINE COMPOUNDS | 89 | 54 | All SZGR 2.0 genes in this pathway |
| REACTOME BILE SALT AND ORGANIC ANION SLC TRANSPORTERS | 11 | 6 | All SZGR 2.0 genes in this pathway |
| BLALOCK ALZHEIMERS DISEASE UP | 1691 | 1088 | All SZGR 2.0 genes in this pathway |
| TUOMISTO TUMOR SUPPRESSION BY COL13A1 DN | 17 | 11 | All SZGR 2.0 genes in this pathway |
| YOSHIMURA MAPK8 TARGETS UP | 1305 | 895 | All SZGR 2.0 genes in this pathway |
| FEVR CTNNB1 TARGETS DN | 553 | 343 | All SZGR 2.0 genes in this pathway |