Gene Page: SUMO3
Summary ?
| GeneID | 6612 |
| Symbol | SUMO3 |
| Synonyms | SMT3A|SMT3H1|SUMO-3|Smt3B |
| Description | small ubiquitin-like modifier 3 |
| Reference | MIM:602231|HGNC:HGNC:11124|Ensembl:ENSG00000184900|HPRD:03754|Vega:OTTHUMG00000090256 |
| Gene type | protein-coding |
| Map location | 21q22.3 |
| Pascal p-value | 0.619 |
| Sherlock p-value | 0.747 |
| DEG p-value | DEG:Zhao_2015:p=5.59e-04:q=0.0926 |
| Fetal beta | -0.615 |
Gene in Data Sources
| Gene set name | Method of gene set | Description | Info |
|---|---|---|---|
| DEG:Zhao_2015 | RNA Sequencing analysis | Transcriptome sequencing and genome-wide association analyses reveal lysosomal function and actin cytoskeleton remodeling in schizophrenia and bipolar disorder. |
Section I. Genetics and epigenetics annotation
Section II. Transcriptome annotation
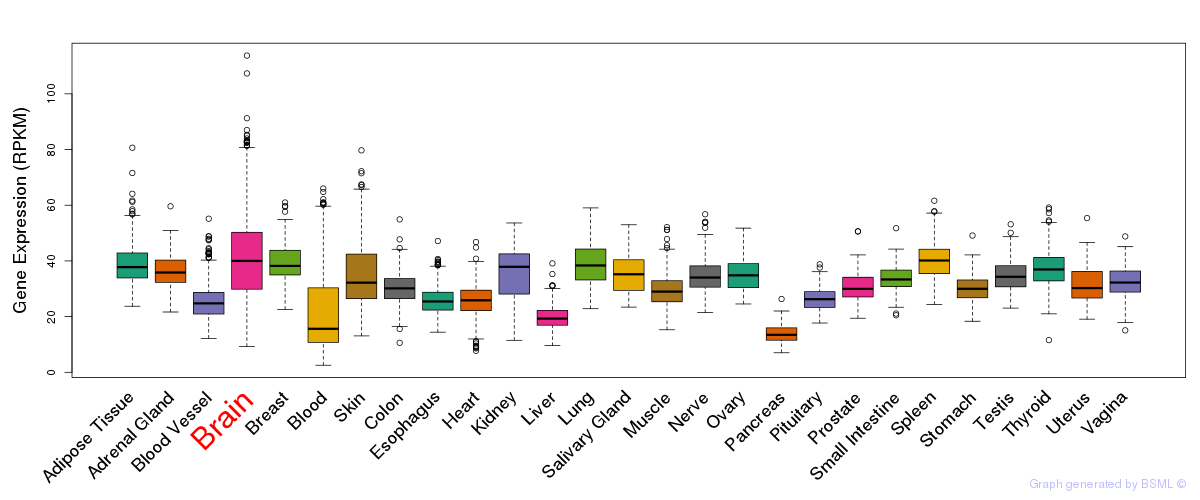
General gene expression (GTEx)

Gene expression during devlopment (BrainCloud)
Footnote:
A total of 269 time points ploted, with n=38 fetal samples (x=1:38). Each triangle represents one time point.
Gene expression of temporal and spatial changes (BrainSpan)
Footnote:
SC: sub-cortical regions; SM: sensory-motor regions; FC: frontal cortex; and TP: temporal-parietal cortex
ST1: fetal (13 - 26 postconception weeks), ST2: early infancy to late childhood (4 months to 11 years), and ST3: adolescence to adulthood (13 - 23 years)
The bar shown representes the lower 25% and upper 25% of the expression distribution.
Top co-expressed genes in brain regions
| Top 10 positively co-expressed genes | ||
| Gene | Pearson's Correlation | Spearman's Correlation |
| DPF2 | 0.89 | 0.84 |
| H2AFY | 0.89 | 0.84 |
| BUB3 | 0.88 | 0.87 |
| H3F3B | 0.88 | 0.80 |
| LRRC42 | 0.88 | 0.82 |
| TCF12 | 0.88 | 0.80 |
| MED20 | 0.88 | 0.84 |
| MTHFD1 | 0.87 | 0.86 |
| C18orf10 | 0.87 | 0.86 |
| ZNF207 | 0.87 | 0.87 |
| Top 10 negatively co-expressed genes | ||
| Gene | Pearson's Correlation | Spearman's Correlation |
| AF347015.31 | -0.64 | -0.77 |
| MT-CO2 | -0.64 | -0.77 |
| AF347015.33 | -0.62 | -0.74 |
| AF347015.27 | -0.62 | -0.76 |
| MT-CYB | -0.62 | -0.74 |
| AF347015.8 | -0.62 | -0.76 |
| FXYD1 | -0.60 | -0.74 |
| AF347015.21 | -0.60 | -0.78 |
| IFI27 | -0.60 | -0.73 |
| HIGD1B | -0.59 | -0.74 |
Section V. Pathway annotation
| Pathway name | Pathway size | # SZGR 2.0 genes in pathway | Info |
|---|---|---|---|
| GAZDA DIAMOND BLACKFAN ANEMIA ERYTHROID DN | 493 | 298 | All SZGR 2.0 genes in this pathway |
| ELVIDGE HYPOXIA DN | 146 | 94 | All SZGR 2.0 genes in this pathway |
| SPIELMAN LYMPHOBLAST EUROPEAN VS ASIAN DN | 584 | 395 | All SZGR 2.0 genes in this pathway |
| SCHAEFFER PROSTATE DEVELOPMENT 12HR DN | 57 | 45 | All SZGR 2.0 genes in this pathway |
| BLALOCK ALZHEIMERS DISEASE UP | 1691 | 1088 | All SZGR 2.0 genes in this pathway |
| CUI TCF21 TARGETS 2 UP | 428 | 266 | All SZGR 2.0 genes in this pathway |
| MONNIER POSTRADIATION TUMOR ESCAPE UP | 393 | 244 | All SZGR 2.0 genes in this pathway |
| HELLER HDAC TARGETS DN | 292 | 189 | All SZGR 2.0 genes in this pathway |
| HELLER HDAC TARGETS SILENCED BY METHYLATION DN | 281 | 179 | All SZGR 2.0 genes in this pathway |
| MITSIADES RESPONSE TO APLIDIN DN | 249 | 165 | All SZGR 2.0 genes in this pathway |
| SCHRAETS MLL TARGETS UP | 35 | 21 | All SZGR 2.0 genes in this pathway |
| AGUIRRE PANCREATIC CANCER COPY NUMBER DN | 238 | 145 | All SZGR 2.0 genes in this pathway |
| YAO TEMPORAL RESPONSE TO PROGESTERONE CLUSTER 13 | 172 | 107 | All SZGR 2.0 genes in this pathway |
| KIM ALL DISORDERS OLIGODENDROCYTE NUMBER CORR UP | 756 | 494 | All SZGR 2.0 genes in this pathway |
| KIM BIPOLAR DISORDER OLIGODENDROCYTE DENSITY CORR UP | 682 | 440 | All SZGR 2.0 genes in this pathway |
| KIM ALL DISORDERS DURATION CORR DN | 146 | 90 | All SZGR 2.0 genes in this pathway |
| PILON KLF1 TARGETS DN | 1972 | 1213 | All SZGR 2.0 genes in this pathway |
| KRIEG HYPOXIA NOT VIA KDM3A | 770 | 480 | All SZGR 2.0 genes in this pathway |