Gene Page: SYT5
Summary ?
| GeneID | 6861 |
| Symbol | SYT5 |
| Synonyms | - |
| Description | synaptotagmin 5 |
| Reference | MIM:600782|HGNC:HGNC:11513|HPRD:02870| |
| Gene type | protein-coding |
| Map location | 19q13.42|11p |
| Pascal p-value | 0.013 |
| Sherlock p-value | 0.118 |
| DEG p-value | DEG:Maycox_2009:CC_BA10_fold_change=-1.22:CC_BA10_disease_P=0.0030:HBB_BA9_fold_change=-1.40:HBB_BA9_disease_P=0.0452 |
| Fetal beta | -1.008 |
| DMG | 1 (# studies) |
| eGene | Cerebellar Hemisphere Cerebellum Myers' cis & trans |
| Support | EXOCYTOSIS G2Cdb.human_BAYES-COLLINS-HUMAN-PSD-CONSENSUS G2Cdb.human_BAYES-COLLINS-HUMAN-PSD-FULL G2Cdb.human_BAYES-COLLINS-MOUSE-PSD-CONSENSUS G2Cdb.human_clathrin G2Cdb.human_Synaptosome CompositeSet |
Gene in Data Sources
| Gene set name | Method of gene set | Description | Info |
|---|---|---|---|
| CV:PGCnp | Genome-wide Association Study | GWAS | |
| DEG:Maycox_2009 | Microarray to determine the expression of over 30000 mRNA transcripts in post-mortem tissue | We included 51 genes whose expression changes are common between two schizophrenia cohorts. | |
| DMG:Wockner_2014 | Genome-wide DNA methylation analysis | This dataset includes 4641 differentially methylated probes corresponding to 2929 unique genes between schizophrenia patients (n=24) and controls (n=24). | 1 |
| GO_Annotation | Mapping neuro-related keywords to Gene Ontology annotations | Hits with neuro-related keywords: 4 |
Section I. Genetics and epigenetics annotation
 Differentially methylated gene
| Probe | Chromosome | Position | Nearest gene | P (dis) | Beta (dis) | FDR (dis) | Study |
|---|---|---|---|---|---|---|---|
| cg22066304 | 19 | 55691730 | SYT5 | 1.36E-5 | 0.373 | 0.014 | DMG:Wockner_2014 |
eQTL annotation
| SNP ID | Chromosome | Position | eGene | Gene Entrez ID | pvalue | qvalue | TSS distance | eQTL type |
|---|---|---|---|---|---|---|---|---|
| rs6693235 | chr1 | 120004691 | SYT5 | 6861 | 0.02 | trans |
Section II. Transcriptome annotation
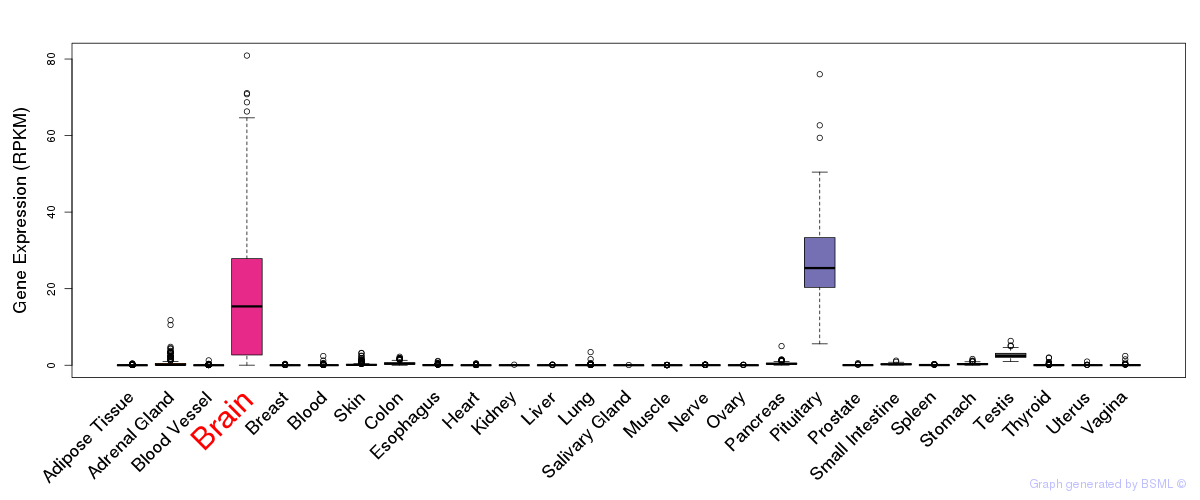
General gene expression (GTEx)
Gene expression during devlopment (BrainCloud)
Footnote:
A total of 269 time points ploted, with n=38 fetal samples (x=1:38). Each triangle represents one time point.
Gene expression of temporal and spatial changes (BrainSpan)
Footnote:
SC: sub-cortical regions; SM: sensory-motor regions; FC: frontal cortex; and TP: temporal-parietal cortex
ST1: fetal (13 - 26 postconception weeks), ST2: early infancy to late childhood (4 months to 11 years), and ST3: adolescence to adulthood (13 - 23 years)
The bar shown representes the lower 25% and upper 25% of the expression distribution.
Top co-expressed genes in brain regions
| Top 10 positively co-expressed genes | ||
| Gene | Pearson's Correlation | Spearman's Correlation |
| WDR85 | 0.87 | 0.85 |
| RHOT2 | 0.87 | 0.84 |
| FBXL6 | 0.87 | 0.87 |
| TUBGCP6 | 0.86 | 0.85 |
| ANKS3 | 0.86 | 0.86 |
| RP3-402G11.1 | 0.86 | 0.82 |
| RFNG | 0.85 | 0.87 |
| ZNF276 | 0.85 | 0.85 |
| CPT1B | 0.85 | 0.81 |
| CDK9 | 0.85 | 0.82 |
| Top 10 negatively co-expressed genes | ||
| Gene | Pearson's Correlation | Spearman's Correlation |
| AF347015.31 | -0.58 | -0.58 |
| AF347015.27 | -0.57 | -0.58 |
| AF347015.21 | -0.55 | -0.64 |
| MT-CO2 | -0.54 | -0.56 |
| MT-CYB | -0.54 | -0.54 |
| AF347015.8 | -0.53 | -0.55 |
| MT-ATP8 | -0.50 | -0.61 |
| AF347015.15 | -0.50 | -0.52 |
| AF347015.33 | -0.49 | -0.51 |
| AF347015.2 | -0.49 | -0.53 |
Section III. Gene Ontology annotation
| Molecular function | GO term | Evidence | Neuro keywords | PubMed ID |
|---|---|---|---|---|
| GO:0005509 | calcium ion binding | IEA | - | |
| GO:0005215 | transporter activity | IEA | - | |
| Biological process | GO term | Evidence | Neuro keywords | PubMed ID |
| GO:0007268 | synaptic transmission | TAS | neuron, Synap, Neurotransmitter (GO term level: 6) | 9177789 |
| GO:0006810 | transport | IEA | - | |
| Cellular component | GO term | Evidence | Neuro keywords | PubMed ID |
| GO:0043025 | cell soma | IEA | axon, dendrite (GO term level: 4) | - |
| GO:0008021 | synaptic vesicle | IEA | Synap, Neurotransmitter (GO term level: 12) | - |
| GO:0043005 | neuron projection | IEA | neuron, axon, neurite, dendrite (GO term level: 5) | - |
| GO:0045202 | synapse | IEA | neuron, Synap, Neurotransmitter, Glial (GO term level: 2) | - |
| GO:0055038 | recycling endosome membrane | IEA | - | |
| GO:0005794 | Golgi apparatus | IDA | 18029348 | |
| GO:0005768 | endosome | IEA | - | |
| GO:0016020 | membrane | IEA | - | |
| GO:0016021 | integral to membrane | IEA | - | |
| GO:0048471 | perinuclear region of cytoplasm | IEA | - | |
| GO:0030054 | cell junction | IEA | - | |
| GO:0031410 | cytoplasmic vesicle | IEA | - |
Section V. Pathway annotation
| Pathway name | Pathway size | # SZGR 2.0 genes in pathway | Info |
|---|---|---|---|
| REACTOME INTEGRATION OF ENERGY METABOLISM | 120 | 84 | All SZGR 2.0 genes in this pathway |
| REACTOME REGULATION OF INSULIN SECRETION | 93 | 65 | All SZGR 2.0 genes in this pathway |
| KOYAMA SEMA3B TARGETS UP | 292 | 168 | All SZGR 2.0 genes in this pathway |
| BLALOCK ALZHEIMERS DISEASE DN | 1237 | 837 | All SZGR 2.0 genes in this pathway |
| XU GH1 EXOGENOUS TARGETS UP | 85 | 50 | All SZGR 2.0 genes in this pathway |
| FIRESTEIN PROLIFERATION | 175 | 125 | All SZGR 2.0 genes in this pathway |
| AGUIRRE PANCREATIC CANCER COPY NUMBER UP | 298 | 174 | All SZGR 2.0 genes in this pathway |
| MIKKELSEN ES ICP WITH H3K4ME3 | 718 | 401 | All SZGR 2.0 genes in this pathway |
| LE NEURONAL DIFFERENTIATION UP | 18 | 13 | All SZGR 2.0 genes in this pathway |
| FOSTER KDM1A TARGETS UP | 266 | 142 | All SZGR 2.0 genes in this pathway |
Section VI. microRNA annotation
| miRNA family | Target position | miRNA ID | miRNA seq | ||
|---|---|---|---|---|---|
| UTR start | UTR end | Match method | |||
| miR-219 | 293 | 300 | 1A,m8 | hsa-miR-219brain | UGAUUGUCCAAACGCAAUUCU |
| miR-330 | 287 | 294 | 1A,m8 | hsa-miR-330brain | GCAAAGCACACGGCCUGCAGAGA |
- SZ: miRNAs which differentially expressed in brain cortex of schizophrenia patients comparing with control samples using microarray. Click here to see the list of SZ related miRNAs.
- Brain: miRNAs which are expressed in brain based on miRNA microarray expression studies. Click here to see the list of brain related miRNAs.