Gene Page: TCTA
Summary ?
| GeneID | 6988 |
| Symbol | TCTA |
| Synonyms | - |
| Description | T-cell leukemia translocation altered |
| Reference | MIM:600690|HGNC:HGNC:11692|Ensembl:ENSG00000145022|HPRD:15977|Vega:OTTHUMG00000156846 |
| Gene type | protein-coding |
| Map location | 3p21 |
| Pascal p-value | 0.032 |
| Sherlock p-value | 0.522 |
| Fetal beta | -1.092 |
| eGene | Myers' cis & trans |
Gene in Data Sources
| Gene set name | Method of gene set | Description | Info |
|---|---|---|---|
| CV:PGCnp | Genome-wide Association Study | GWAS | |
| DMG:Wockner_2014 | Genome-wide DNA methylation analysis | This dataset includes 4641 differentially methylated probes corresponding to 2929 unique genes between schizophrenia patients (n=24) and controls (n=24). | 1 |
| PMID:cooccur | High-throughput literature-search | Systematic search in PubMed for genes co-occurring with SCZ keywords. A total of 3027 genes were included. | |
| Literature | High-throughput literature-search | Co-occurance with Schizophrenia keywords: schizophrenia,schizophrenias | Click to show details |
Section I. Genetics and epigenetics annotation
 Differentially methylated gene
| Probe | Chromosome | Position | Nearest gene | P (dis) | Beta (dis) | FDR (dis) | Study |
|---|---|---|---|---|---|---|---|
| cg16951854 | 3 | 49449507 | RHOA;TCTA | 9.37E-5 | 0.351 | 0.027 | DMG:Wockner_2014 |
eQTL annotation
| SNP ID | Chromosome | Position | eGene | Gene Entrez ID | pvalue | qvalue | TSS distance | eQTL type |
|---|---|---|---|---|---|---|---|---|
| rs10179642 | chr2 | 9683695 | TCTA | 6988 | 0.14 | trans | ||
| rs38153 | chr7 | 20044600 | TCTA | 6988 | 0.05 | trans | ||
| rs17171901 | chr7 | 41582999 | TCTA | 6988 | 0.02 | trans | ||
| rs11232895 | chr11 | 81555576 | TCTA | 6988 | 0.13 | trans |
Section II. Transcriptome annotation
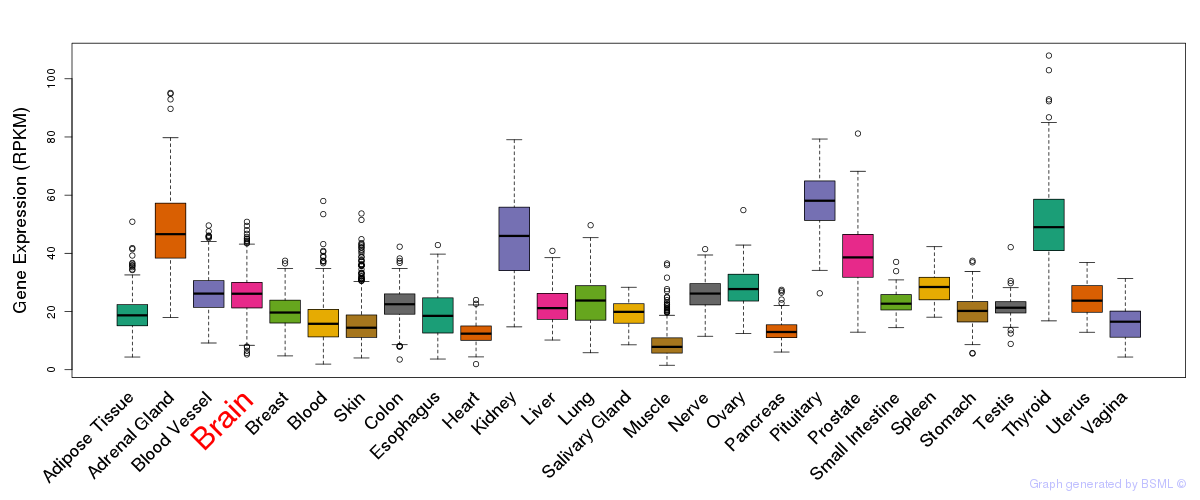
General gene expression (GTEx)
Gene expression during devlopment (BrainCloud)
Footnote:
A total of 269 time points ploted, with n=38 fetal samples (x=1:38). Each triangle represents one time point.
Gene expression of temporal and spatial changes (BrainSpan)
Footnote:
SC: sub-cortical regions; SM: sensory-motor regions; FC: frontal cortex; and TP: temporal-parietal cortex
ST1: fetal (13 - 26 postconception weeks), ST2: early infancy to late childhood (4 months to 11 years), and ST3: adolescence to adulthood (13 - 23 years)
The bar shown representes the lower 25% and upper 25% of the expression distribution.
Top co-expressed genes in brain regions
| Top 10 positively co-expressed genes | ||
| Gene | Pearson's Correlation | Spearman's Correlation |
| PPP1R3F | 0.91 | 0.91 |
| SNPH | 0.90 | 0.92 |
| SAPS1 | 0.90 | 0.90 |
| NACC1 | 0.89 | 0.89 |
| CAMTA2 | 0.89 | 0.91 |
| TTC7B | 0.89 | 0.92 |
| ARHGEF4 | 0.88 | 0.89 |
| PINK1 | 0.88 | 0.88 |
| LENG3 | 0.88 | 0.85 |
| TOM1L2 | 0.86 | 0.87 |
| Top 10 negatively co-expressed genes | ||
| Gene | Pearson's Correlation | Spearman's Correlation |
| FAM159B | -0.51 | -0.69 |
| C9orf46 | -0.50 | -0.53 |
| RBMX2 | -0.48 | -0.49 |
| C21orf57 | -0.48 | -0.51 |
| SNRPG | -0.47 | -0.55 |
| SPINK8 | -0.46 | -0.47 |
| RPL13AP22 | -0.46 | -0.62 |
| RPL24 | -0.46 | -0.47 |
| RP9P | -0.45 | -0.51 |
| RPL35A | -0.45 | -0.53 |
Section V. Pathway annotation
| Pathway name | Pathway size | # SZGR 2.0 genes in pathway | Info |
|---|---|---|---|
| HORIUCHI WTAP TARGETS UP | 306 | 188 | All SZGR 2.0 genes in this pathway |
| DODD NASOPHARYNGEAL CARCINOMA UP | 1821 | 933 | All SZGR 2.0 genes in this pathway |
| RODRIGUES THYROID CARCINOMA POORLY DIFFERENTIATED DN | 805 | 505 | All SZGR 2.0 genes in this pathway |
| RODRIGUES THYROID CARCINOMA ANAPLASTIC DN | 537 | 339 | All SZGR 2.0 genes in this pathway |
| XU HGF TARGETS REPRESSED BY AKT1 DN | 95 | 58 | All SZGR 2.0 genes in this pathway |
| BUYTAERT PHOTODYNAMIC THERAPY STRESS DN | 637 | 377 | All SZGR 2.0 genes in this pathway |
| PENG LEUCINE DEPRIVATION UP | 142 | 93 | All SZGR 2.0 genes in this pathway |
| SANSOM APC TARGETS DN | 366 | 238 | All SZGR 2.0 genes in this pathway |
| IVANOVA HEMATOPOIESIS STEM CELL | 254 | 164 | All SZGR 2.0 genes in this pathway |
| BROWNE HCMV INFECTION 48HR DN | 504 | 323 | All SZGR 2.0 genes in this pathway |
| SARTIPY NORMAL AT INSULIN RESISTANCE DN | 21 | 11 | All SZGR 2.0 genes in this pathway |
| DOUGLAS BMI1 TARGETS DN | 314 | 188 | All SZGR 2.0 genes in this pathway |
| MARSON BOUND BY FOXP3 STIMULATED | 1022 | 619 | All SZGR 2.0 genes in this pathway |
| MARSON BOUND BY FOXP3 UNSTIMULATED | 1229 | 713 | All SZGR 2.0 genes in this pathway |
| MASSARWEH TAMOXIFEN RESISTANCE UP | 578 | 341 | All SZGR 2.0 genes in this pathway |
| ZHANG TLX TARGETS 36HR UP | 221 | 150 | All SZGR 2.0 genes in this pathway |
| ZHANG TLX TARGETS 60HR UP | 293 | 203 | All SZGR 2.0 genes in this pathway |
| ZHANG TLX TARGETS UP | 108 | 78 | All SZGR 2.0 genes in this pathway |
| JISON SICKLE CELL DISEASE UP | 181 | 106 | All SZGR 2.0 genes in this pathway |
| DANG REGULATED BY MYC DN | 253 | 192 | All SZGR 2.0 genes in this pathway |
| KIM ALL DISORDERS OLIGODENDROCYTE NUMBER CORR UP | 756 | 494 | All SZGR 2.0 genes in this pathway |
| KIM BIPOLAR DISORDER OLIGODENDROCYTE DENSITY CORR UP | 682 | 440 | All SZGR 2.0 genes in this pathway |
| GOBERT OLIGODENDROCYTE DIFFERENTIATION DN | 1080 | 713 | All SZGR 2.0 genes in this pathway |